Versions Compared

Key

  • This line was added.
  • This line was removed.
  • Formatting was changed.

...

Dataset wrap
Nameou.xpt Observational and Experimental Unit Identifiers

Experimental unit - The unit to which the treatment is applied, eg. Test tube

Observational unit - The unit on which the response is measured. (This may not be the same as the experimental unit.)

Rowcaps
Rows 1-5:Shows the values of the experimental unit identifiers and associated observational unit identifiers for the set, SetA.
SetA is the first row of the raw data table, see the row labeled "SetA" in the table, Raw Data for Study 8325064.
Rows 6-8:Shows the values of the experimental unit identifiers and associated observational unit identifiers for the set, SetF.
SetF is the sixth row of the raw data table, see the row labeled "SetF" in the table, Raw Data for Study 8325064.
Rows 9-11:Shows the values of the experimental unit identifiers and associated observational unit identifiers for the set, SetG.
SetA SetG is the seventh row of the raw data table, see the row labeled "SetG" in the table, Raw Data for Study 8325064.
Row 12-14:Shows the values of the experimental unit identifiers and associated observational unit identifiers for the set, SetR.
SetR is the eighteenth row of the raw data table, see the row labeled "SetR" in the table, Raw Data for Study 8325064.
Rows 2-4:
Rows 1, 6:

OBUID in this example is defined by the sponsor by the location on one of multiple exposure/incubation plates.

Dataset2
RowSTUDYIDASSAYIDDOMAINSETCD EUID OBUID  
18325064AmesOUSetAA0_1
28325064AmesOUSetAA0_2
38325064AmesOUSetAA0_3
48325064AmesOUSetAA0_4
58325064AmesOUSetAA0_5

6

8325064AmesOUSetFF56_1
78325064AmesOUSetFF56_2
88325064AmesOUSetFF56_3
98325064AmesOUSetGG7_1
108325064AmesOUSetGG7_2
118325064AmesOUSetG

G

7_3
128325064AmesOUSetRR18_1
138325064AmesOUSetRR18_2
148325064AmesOUSetRR18_3
Expand
titlegt.xpt (similar to LB)
Dataset wrap
Namegt.xpt
Rowcaps
Rows 1-7:Show values collected for the set, SetA. 
Rows 8-15:Shows values collected for the set, SetF.  
Rows 6-7:Show a suggested use of the LBSCAT variable. It could be used to further classify types of tests within a laboratory panel (e.g., "DIFFERENTIAL").
Rows 6,7,12,13, x,x,x,x:Show values collected (e.g., MEAN, STANDARD DEVIATION, and/or FOLD INCREASE) that apply to all of the observational units within the experimental unit, as show by OBUID = "ALL". 
Row 9:Shows the proper use of the LBSTAT variable to indicate "NOT DONE," when the fact that the test was done was documented.
Row 12:The subject had Cholesterol measured. The normal range for this test is <200 mg/dL. The value <200 may not be used in the normal range variables LBORNRHI or LBSTNRHI; however, a sponsor may decide, e.g., to enter "0" into LBORNRLO and "199" in LBORNRHI. The sponsor must define the appropriate value for all of the normal range variables.
Row 13:Shows the use of LBUSCHFL to indicate that the test result was obtained from an unscheduled blood collection. In this case, the subject was moribund and a blood sample was taken prior to sacrifice.
Rows 1, 6:Use records in the SUPPLB dataset example to show biological significance assigned by the investigator for test results.
Dataset2expand
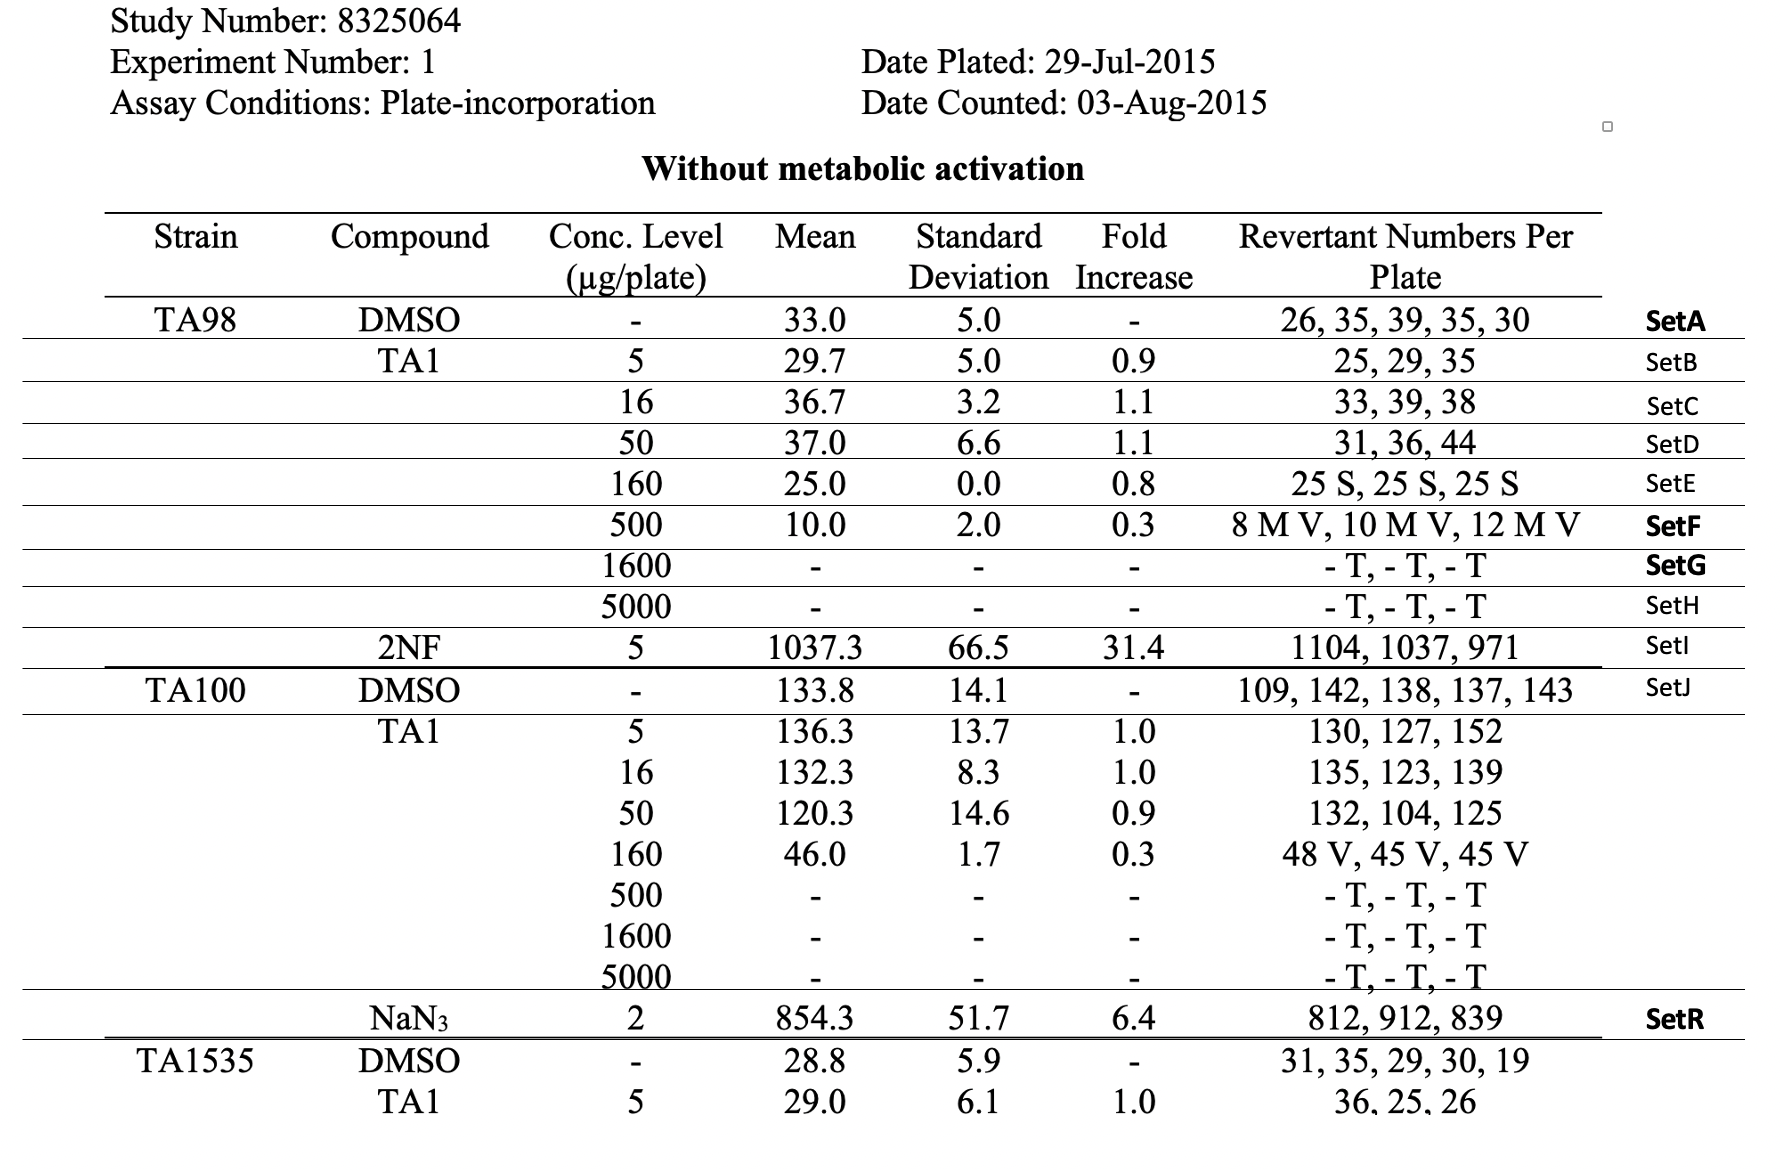
titleRaw Data Table for Study 8325064

Image Added

Dataset2
RowSTUDYIDRowSTUDYIDASSAYIDDOMAINTXSETCDEUIDOUIDGTSEQGTTESTCDGTTESTGTORRESGTORRESUGTCOLSRT (coll. summ. result type)GTSTRESCGTSTRESNGTSTRESUGTDTCGTMETHOD
18325064AmesGTSETA A0_11RPPRevertant Numbers Per Plate26COLONIES
2626COLONIES
2015-08-03

INSTRUMENT COUNTED

28325064AmesGTSETA A0_22RPPRevertant Numbers Per Plate35COLONIES
3535

2015-08-03
INSTRUMENT COUNTED
38325064AmesGTSETA A0_33RPPRevertant Numbers Per Plate39COLONIES
3939

2015-08-03
INSTRUMENT COUNTED
48325064AmesGTSETA A0_44RPPRevertant Numbers Per Plate35COLONIES
3535

2015-08-03

INSTRUMENT COUNTED

58325064AmesGTSETA A0_55RPPRevertant Numbers Per Plate30COLONIES
3030
2015-08-03INSTRUMENT COUNTED
68325064AmesGTSETA AALL6RPPRevertant Numbers Per Plate33.0COLONIESMEAN33.033.0


78325064AmesGTSETA AALL7RPPRevertant Numbers Per Plate5.0COLONIESSTANDARD DEVIATION5.05.0

INSTRUMENT COUNTED


88325064AmesGTSETFF56_11RPPRevertant Numbers Per Plate8COLONIES
88

MANUALLY COUNTED
98325064AmesGTSETFF65_112CYTOTOXCytotoxicityVery thin background bacterial lawnCOLONIES
V


108325064AmesGTSETF F56_223RPPRevertant Numbers Per Plate10COLONIES
1010

MANUALLY COUNTED
118325064AmesGTSETF F56_334RPPRevertant Numbers Per Plate12COLONIES
1212

MANUALLY COUNTED
128325064AmesGTSETFFALL65RPPMEANMean of Revertant Numbers Per Plate

10.0


COLONIESMEAN

10.0


10.0


138325064AmesGTSETF FALL76RPPSTDDVStandard Deviation of Revertant Numbers Per Plate2.0COLONIESSTANDARD DEVIATION2.02.0


148325064AmesGTSETF FALL87RPPFDINCFold Increase of Revertant Numbers Per Plate0.3COLONIESFOLD INCREASE0.30.315


8325064AmesGTSETF 9CYTOTOXCytotoxicityVery thin background bacterial lawnVSETGG8325064AmesGTSETG5_11RPPRevertant Numbers Per Plate1104

11041104


8325064AmesGTSETGSETIG5_22RPPRevertant Numbers Per Plate1037

10371037


8325064AmesGTSETGSETIG5_33RPPRevertant Numbers Per Plate971

971971


8325064AmesGTSETRSETIRALL6
RPPMEANMean of Revertant Numbers Per Plate

1037.3


1037.3


1037.3


8325064AmesGTSETRSETIRALL7
RPPSTDDVStandard Deviation of Revertant Numbers Per Plate66.5

66.566.5


8325064AmesGTSETRSETIRALL8
RPPFLDINCFold Increase of Revertant Numbers Per Plate31.4

31.431.4