The core of the Trial Design Model is the TA dataset. For each arm of the trial, the TA dataset contains 1 record for each occurrence of an element in the path of the arm.
Although the TA dataset has 1 record for each trial element traversed by subjects assigned to the arm, it is generally more useful to work out the overall design of the trial at the study cell level first, then to work out the elements within each study cell, and finally to develop the definitions of the elements that are contained in the Trial Elements (TE) table.
When working out the design of a trial, it is generally useful to draw diagrams such as those mentioned in ICH E3. The protocol may include a diagram that can serve as a starting point. Such a diagram can then be converted into a trial design matrix that displays the study cells and which in turn can be converted into the TA dataset.
This section uses example trials of increasing complexity to illustrate the concepts of trial design. For each example trial, the process of working out the TA table is illustrated by means of a series of diagrams and tables, including:
- A diagram showing the branching structure of the trial in a “study schema” format such as might appear in a protocol
- A diagram that shows the “prospective” view of the trial (i.e., the view of those participating in the trial). This is similar to the study schema view in that it usually shows a single pool of subjects at the beginning of the trial, with the pool of subjects being split into separate product groups at randomizations and other branches. Such diagrams include the epochs of the trial, and, for each group of subjects and each epoch, the sequence of elements within each epoch for that product group. The arms are also indicated on these diagrams.
- A diagram that shows the “retrospective” view of the trial (i.e., the view of the analyst reporting on the trial). This style of diagram looks more like a matrix; it is also more like the structure of the TA dataset. The retrospective view is arm-centered and shows, for each study cell (epoch/arm combination) the sequence of elements within that study cell. It can be thought of as showing, for each arm, the elements traversed by a subject who completed that arm as intended.
- If the trial is blinded, a diagram that shows the trial as it appears to a blinded participant
- A trial design matrix, an alternative format for representing most of the information in the diagram that shows arms and epochs, and which emphasizes the study cells
- The TA dataset
The TE dataset contains the definitions of the elements that appear in the TA dataset. An element may appear multiple times in the TA table because it appears either (1) in multiple arms, (2) multiple times within an arm, or (3) both. However, an element will appear only once in the TE table.
Each row in the TE dataset may be thought of as representing a "unique element" in the same sense of "unique" as a CRF template page for a collecting certain type of data is referred to as "unique page." For instance, a CRF might be described as containing 87 pages, but only 23 unique pages. By analogy, the trial design matrix in Example Trial 1 below has 12 study cells, each of which contains 1 element, but the same trial design matrix contains only 5 unique elements, so the TE dataset for that trial has only 6 records.
An element is a building block for creating study cells, and an arm is composed of study cells. Or, from another point of view, an arm is composed of elements; that is, the trial design assigns subjects to arms, which comprise a sequence of steps (elements).
Trial elements represent an interval of time that serves a purpose in the trial and are associated with certain activities affecting the subject. “Week 2 to week 4” is not a valid element. A valid element has a name that describes the purpose of the element and includes a description of the activity or event that marks the subject's transition into the element as well as the conditions for leaving the element.
Example 1 should be reviewed before reading other examples, as it explains the conventions used for all diagrams and tables in the examples.
Example
Diagrams that represent study schemas generally conceive of time as moving from left to right, using horizontal lines to represent periods of time and slanting lines to represent branches into separate arms, convergence into a common follow-up, or crossover to a different product.
In this type of document, diagrams are drawn using "blocks" corresponding to trial elements rather than horizontal lines. Trial elements are the various time periods of the trial and might otherwise be "hidden" in a single horizontal line. See Section 3.3.1.1.3, Trial Elements (TE), for more information about defining trial elements. In general, the elements of a trial will be fairly clear. However, in the process of working out a trial design, alternative definitions of trial elements may be considered, in which case diagrams for each alternative may be constructed.
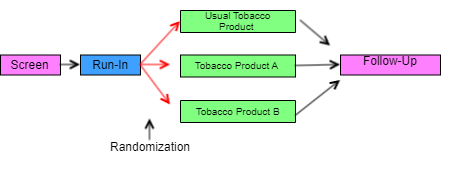
In the study schema diagrams in this example, the only slanting lines used are those that represent branches (i.e., decision points where subjects are divided into separate groups). One advantage of this style of diagram, which does not show convergence of separate paths into a single block, is that the number of arms in the trial can be determined by counting the number of parallel paths at the right end of the diagram.
As illustrated in the study schema diagram for Example Trial 1, this simple parallel trial has 3 arms, corresponding to the 3 possible left-to-right "paths" through the trial. Each path corresponds to 1 of the 3 elements at the right end of the diagram. Randomization is represented by the 3 red arrows leading from the Run-in block.
Example Study 1, Parallel Design Study Schema
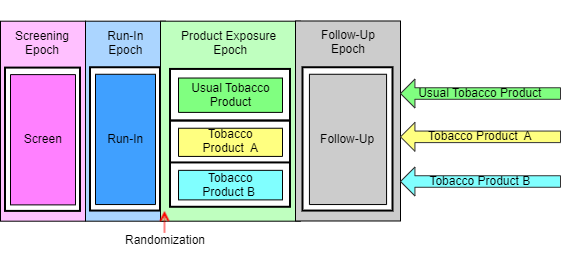
The next diagram for this trial shows the 4 epochs of the trial, indicates the 3 arms, and shows the sequence of elements for each group of subjects in each epoch. The arrows are at the right side of the diagram because it is at the end of the trial that all the separate paths through the trial can be seen. Note that, in this diagram, randomization—which was shown using 3 red arrows connecting the Run-in block with the 3 product exposure blocks in the first diagram—is indicated by a note with an arrow pointing to the line between 2 epochs.
Example Study 1, Parallel Design Prospective View
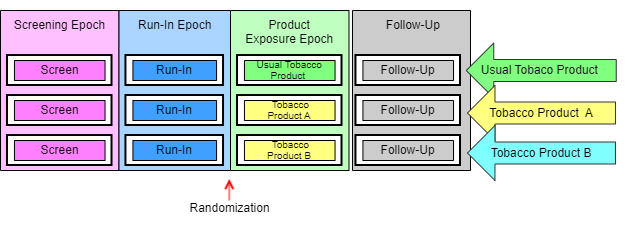
The next diagram can be thought of as the retrospective view of a trial, the view back from a point in time when a subject’s assignment to an arm is known. In this view, the trial appears as a grid, with an arm represented by a series of study cells, one for each epoch, and a sequence of elements within each study cell. In this example (as in many trials), there is exactly 1 element in each study cell. In more complicated designs this is not always the case.
Example Study 1, Parallel Design Retrospective View
The next diagram shows the trial from the viewpoint of blinded participants. To blinded participants in this trial, all arms look alike. They know when a subject is in the screen element or the run-in element, but when a subject is in the product exposure epoch, participants know only that the subject is receiving a study product, not which study product, and therefore not which element.
Example Study 1, Blinded View

A trial design matrix is a table with a row for each arm in the trial and a column for each epoch in the trial. It is closely related to the retrospective view of the trial, and many users may find it easier to construct a table than to draw a diagram. The cells in the matrix represent the study cells, which are populated with trial elements. In this trial, each study cell contains exactly 1 element.
As illustrated in the following table, the columns of a trial design matrix are the epochs of the trial, the rows are the arms of the trial, and the cells of the matrix (the study cells) contain elements. Note that randomization is not represented in the trial design matrix. All of the preceding diagrams and the trial design matrix are alternative representations of the trial design. None of them contains all the information that will be in the finished TA dataset; users may find it useful to draw some or all of these diagrams when working out the dataset.
Trial Design Matrix
| Screen | Run-in | Study Product Exposure | Follow-Up | |
|---|---|---|---|---|
| Usual Brand | Screen | Run-in | Usual Tobacco Product | Follow-Up |
| A | Screen | Run-in | Tobacco Product A | Follow-Up |
| B | Screen | Run-in | Tobacco Product B | Follow-Up |
For Example Trial 1, the conversion of the trial design matrix into the TA dataset is straightforward. For each cell of the matrix, there is a record in the TA dataset. ARM, EPOCH, and ELEMENT can be populated directly from the matrix. TAETORD acts as a sequence number for the elements within an arm, so it can be populated by counting across the cells in the matrix. The randomization information, which is not represented in the trial design matrix, is held in TABRANCH in the TA dataset. TABRANCH is populated only if there is a branch at the end of an element for the arm. When TABRANCH is populated, it describes how the decision at the branch point would result in a subject being in this arm. TATRANS is not used for this design but as it is an expected variable it is included in the datset.
Example
The following diagram for a crossover study does not use the crossing slanted lines sometimes used to represent crossover studies, because the order of the blocks is sufficient to represent the design of the study. Slanted lines are used only to represent the branch point at randomization, when a subject is assigned to a sequence of study product exposures. As in most crossover studies, the arms are distinguished by the order of study product exposures, with the same study product exposure present in each arm. Note that even though all 3 arms of this study end with the same block (i.e., the block for the follow-up element), the diagram does not show the arms converging into one block. Also note that the same block (the "rest" element) occurs twice within each arm. Elements are conceived of as "reusable" and can appear in more than 1 arm, in more than 1 epoch, and more than once in an arm.


Example Study 2, Crossover Trial Study Schema
The next diagram for this crossover study shows the prospective view of the study; it identifies the epoch and arms of the study, and gives each a name. As for most crossover studies, the objectives of the study will be addressed by comparisons between the arms and by within-subject comparisons between study product exposures. Because the design depends on differentiating the periods during which the subject receives the 3 different study product exposures, there are 3 different study product exposure epochs. The fact that the rest periods are identified as separate epochs suggests that these also play an important part in the design of the study; they are probably designed to allow subjects to return to “baseline,” with data collected to show that this occurred. Note that epochs are not considered reusable; each epoch has a different name, even though all the study product exposure epochs are similar and both the rest epochs are similar. As with the first example study, there is a one-to-one relationship between the epochs of the study and the elements in each arm.
Example Study 2, Crossover Study Prospective View
The next diagram shows the retrospective view of the study.
Example Study 2, Crossover Trial Retrospective View
The last diagram for this study shows the study from the viewpoint of blinded participants. As in the simple parallel study in Example Study 1, blinded participants see only 1 sequence of elements; during the product exposure epochs they do not know which of the product exposure elements a subject is in.
Example Study 2, Crossover Study Blinded View
The following table illustrates the study design matrix for this crossover example study. It corresponds closely to the preceding retrospective diagram.
Trial Design Matrix
| Screen | First Study Product Exposure | First Rest | Second Study Product Exposure | Second Rest | Third Study Product Exposure | Follow-up | |
|---|---|---|---|---|---|---|---|
| U-A-B | Screen | Usual Tobacco Product | Rest | Tobacco Product A | Rest | Tobacco Product B | Follow-up |
| A-U-B | Screen | Tobacco Product A | Rest | Usual Tobacco Product | Rest | Tobacco Product B | Follow-up |
| B-A-U | Screen | Tobacco Product B | Rest | Tobacco Product A | Rest | Usual Tobacco Product | Follow-up |
It is straightforward to produce the TA dataset for this crossover study from the diagram showing arms and epochs, or from the design matrix.
Overview
Content Tools