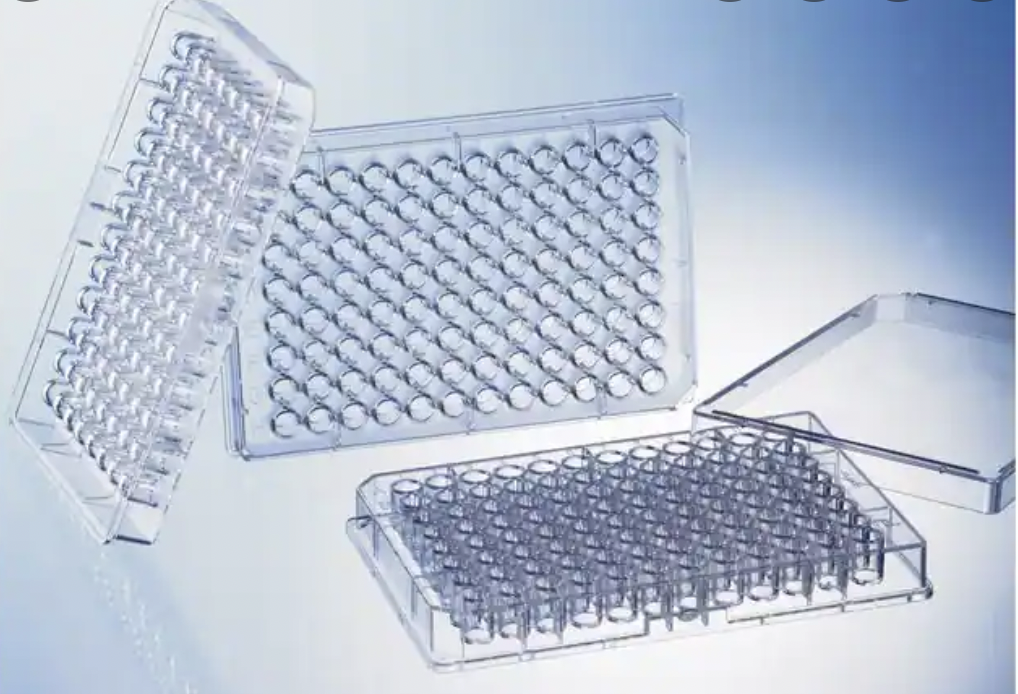
The following shows example data for study 123 in a report table. This report includes summary statistics (i.e., average, standard deviation, coefficient variation) for each plate and an EC50  value for the entire assay. The grey cells in plate 1 are cells that do not contain the NHK cells. value for the entire assay. The grey cells in plate 1 are cells that do not contain the NHK cells. Neutral Red Cytotoxicity Assay Results (Relative Absorbance Data) |
|
|
| Sample ID | Smoke Regime | Replicate Number | Plate Number |
|
| Relative Assay Plate Absorbance Readings |
|
|
|
| Cigarette Smoke Condensate (µg/mL) | SLS (µg/mL) |
| EC50 (µg/ml) | Well Column: | 1 | 2 | 3 | 4 | 5 | 6 | 7 | 8 | 9 | 10 | 11 | 12 |
| Well
Row: | 0 | 10 | 50 | 75 | 100 | 120 | 140 | 160 | 200 | 110 | 200 | 0 |
|
| 030001 | Medium | 1 | 1 | A | 0.046*
| 0.046* | 0.039* | 0.012* | 0.030* | 0.003* | 0.057* | 0.032* | 0.003* | 0.050* | 0.044* | 0.040* |
|
| 030001 | Medium | 1 | 1 | B | 0.048* | 107 | 77.7 | 65.7 | 30.2 | 15.6 | 9.79 | 5.41 | 2.49 | 8.09 | 0.791 | 0.014* |
|
| 030001 | Medium | 1 | 1 | C | 0.005* | 98.6 | 77.4 | 57.7 | 35.8 | 8.09 | 7.36 | 3.22 | 0.791 | 6.38 | 0.061 | 0.050* |
|
| 030001 | Medium | 1 | 1 | D | 0.049* | 94.9 | 81.5 | 38.2 | 31.2 | 7.60 | 5.17 | 3.22 | 0.791 | 5.17 | 0.304 | 0.017* |
|
| 030001 | Medium | 1 | 1 | E | 0.047* | 111 | 78.1 | 64.5 | 32.9 | 8.82 | 5.90 | 2.74 | 1.28 | 10.3 | 0.547 | 0.011* |
|
| 030001 | Medium | 1 | 1 | F | 0.032* | 96.6 | 76.2 | 48.0 | 26.8 | 7.84 | 4.20 | 2.74 | 1.52 | 8.09 | 4.93 | 0.022* |
|
| 030001 | Medium | 1 | 1 | G | 0.044* | 105 | 77.9 | 58.2 | 28.3 | 8.09 | 4.68 | 1.76 | 0.547 | 8.57 | 1.76 | 0.056* |
|
| 030001 | Medium | 1 | 1 | H | 0.056* | 0.013* | 0.040* | 0.008* | 0.013* | 0.002* | 0.029* | 0.018* | 0.006* | 0.016* | 0.024* | 0.046* |
| Average |
| 101 | 78.2 | 54.5 | 29.9 | 9.70 | 6.17 | 3.37 | 1.19 | 8.94 | 1.22 |
|
| Std. Dev. |
| 6 | 2.9 | 9.4 | 3.6 | 2.95 | 2.19 | 1.12 | 0.72 | 2.72 | 1.58 |
|
| Coeff. Var. |
| 5.8 | 3.6 | 17.2 | 11.9 | 30.4 | 35.5 | 33.1 | 61.0 | 30.5 | 129.9 |
|
| *media without cells |
|
|
|
|
|
|
|
|
|
|
|
|
|
| 030001 | Medium | 1 | 2 | A |
| 93.4 | 74.0 | 56.0 | 35.1 | 11.8 | 8.70 | 5.10 | 1.98 | 5.34 | 1.02 |
|
|
| 030001 | Medium | 1 | 2 | B |
| 102 | 75.2 | 53.3 | 35.1 | 11.8 | 7.74 | 5.58 | 3.66 | 5.34 | 1.02 |
|
|
| 030001 | Medium | 1 | 2 | C |
| 107 | 79.0 | 55.0 | 26.5 | 10.1 | 6.06 | 3.66 | 1.74 | 7.02 | 0.780 |
|
|
| 030001 | Medium | 1 | 2 | D |
| 104 | 80.2 | 55.3 | 29.8 | 8.94 | 3.90 | 3.66 | 1.50 | 6.30 | 0.780 |
|
|
| 030001 | Medium | 1 | 2 | E |
| 101 | 75.7 | 54.1 | 26.7 | 4.86 | 4.38 | 1.26 | 1.02 | 6.30 | 1.02 |
|
|
| 030001 | Medium | 1 | 2 | F |
| 110 | 85.7 | 67.7 | 26.0 | 5.34 | 4.62 | 3.42 | 1.50 | 6.30 | 0.540 |
|
|
| 030001 | Medium | 1 | 2 | G |
| 104 | 77.8 | 64.9 | 27.7 | 8.22 | 3.18 | 2.46 | 1.02 | 6.30 | 0.780 |
|
|
| 030001 | Medium | 1 | 2 | H |
| 103 | 71.6 | 58.9 | 25.5 | 9.42 | 4.14 | 3.90 | 1.26 | 4.38 | 0.780 |
|
| Average |
| 103 | 77.4 | 58.1 | 29.0 | 8.82 | 5.34 | 3.63 | 1.71 | 5.91 | 0.840 |
|
| Std. Dev. |
| 5 | 4.4 | 5.3 | 4.0 | 2.63 | 1.97 | 1.37 | 0.86 | 0.83 | 0.170 |
|
| Coeff. Var. |
| 4.6 | 5.6 | 9.2 | 13.6 | 29.8 | 36.9 | 37.6 | 50.0 | 14.1 | 20.2 |
|
| EC50 (µg/ml). Effective concentration at 50% cytotoxicity. (using a specific sigmoidal equation = model). |
|
|
|
|
|
|
|
|
|
|
|
| 123 |
| and results data for the in vitro neutral red uptake (NRU) cytotoxicity assay
in example study 123.