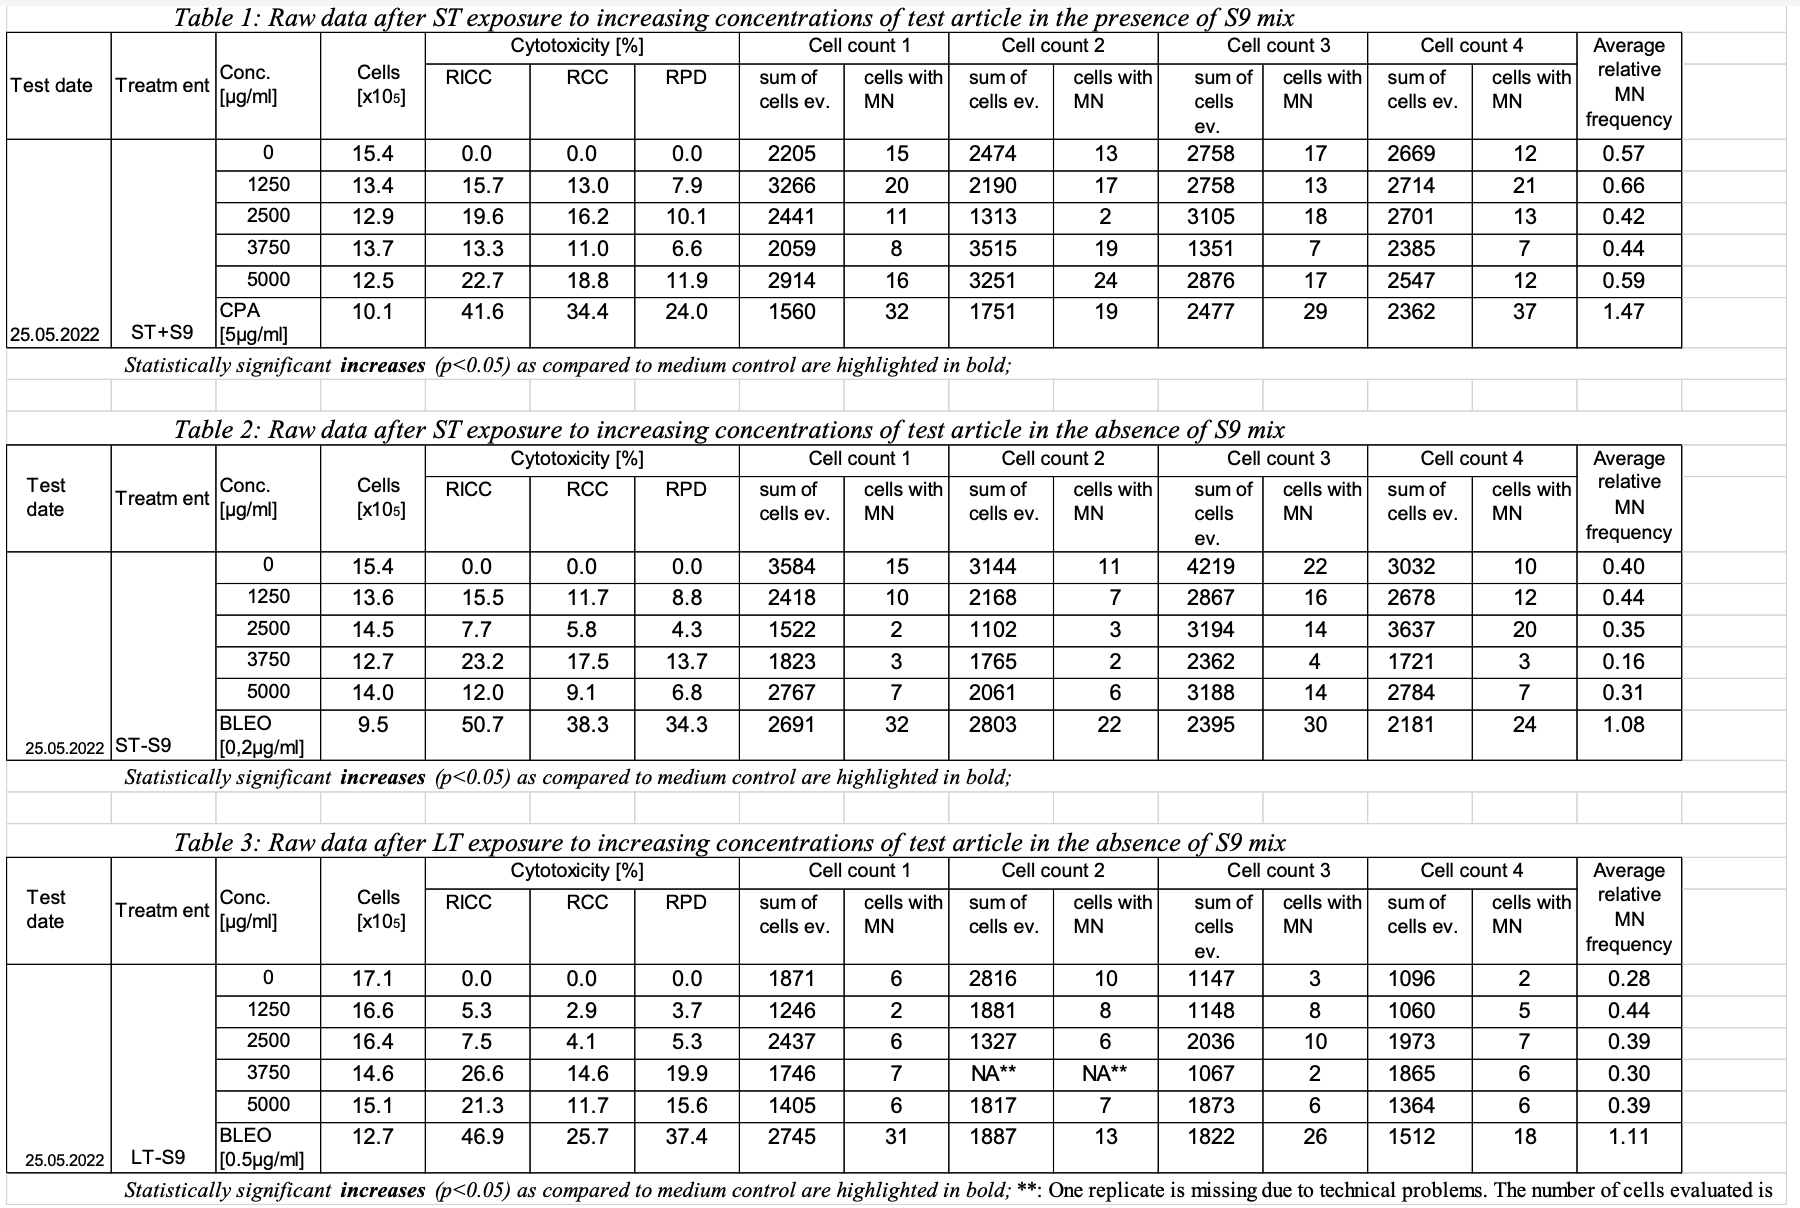
This example shows a sample report table, trial design, and results dataset for study 123 for the determination of the in vitro genotoxicity potential of tobacco products using the in vitro micronucleus assay. TOBA-642
-
Getting issue details...STATUS
Rows 1-2:
Show 2 records for TSPARMCD = "GLPTYP", using TSSEQ to indicate multiple records, since both GLP types apply for this example study.
Row 3:
Shows that this study was conducted as a GLP study.
Rows 4-5:
Show the study start date and study title.
Rows 6-7:
Show the version of SEND Implementation Guide and version of Controlled Terminology used in this study.
Row 8:
Shows the applicant's organization.
Row 9:
Shows that the applicant's study reference ID is not applicable.
Rows 10-13:
Show that TSGRPID has been used to link records (name, location, country) related to the test facility (TSGRPID = 1). The study director is associated with the test facility.
Rows 14-16:
Show that TSGRPID (TSGRPID=2) has been used to link the information on the testing guideline followed on this study (TSTGDNAM, TSTGDORG, TSTGDVER).
Row 17:
Shows the study type for this study.
Row 18:
Shows that this study includes a Mammalian Cell Micronucleus Assay.
Rows 19-20:
Show that the species is human and the cell line is TK6 lymphoblastoid in this study.
ts.xpt
xx.xpt
Row
STUDYID
DOMAIN
TSSEQ
TSGRPID
TSPARMCD
TSPARM
TSVAL
TSVALNF
1
123
TS
1
GLPTYP
Good Laboratory Practice Type
FDA
2
123
TS
2
GLPTYP
Good Laboratory Practice Type
OECD
3
123
TS
1
GLPFL
GLP Flag
Y
4
123
TS
1
STSTDTC
Study Start Date
2022-05-25
5
123
TS
1
STITLE
Study Title
Determination of the in vitro genotoxicity potential using the in vitro Neutral Red Uptake assay
6
123
TS
1
SNDIGVER
SEND Implementation Guide Version
TOBACCO IMPLEMENTATION GUIDE VERSION 1.0
7
123
TS
1
SNDCTVER
SEND Controlled Terminology Version
SEND Terminology 2021-09-30
8
123
TS
1
APPLCNT
Applicant OrganizationTOBA-356
- Jira project doesn't exist or you don't have permission to view it.
Example Applicant, Inc.
9
123
TS
1
APREFID
Study Reference ID
NOT APPLICABLE
10
123
TS
1
1
TSTFNAM
Test Facility Name
Example Test Lab Name
11
123
TS
1
1
TSTFLOC
Test Facility Location
10 Somewhere Street, Montgomery, AL 10000
12
123
TS
1
1
TFCNTRY
Test Facility Country
USA
13
123
TS
1
1
STDIR
Study Director
Dr. R. Smith
14
123
TS
1
2
TSTGDNAM
Testing Guideline Name
GUIDELINE FOR THE TESTING OF CHEMICALS No. 487
15
123
TS
1
2
TSTGDORG
Testing Guideline Organization
OECD
16
123
TS
1
2
TSTGDVER
Testing Guideline Version
29-July-2016
17
123
TS
1
SSTYP
Study Type
GENOTOXICITY IN VITRO
18
123
TS
1
GNTXAID
Genetic Toxicology Assay Identifier
MNvit
19
123
TS
1
SPECIES
Species
HUMAN
20
123
TS
1
CELLLN
Cell Line
TK6 LYMPHOBLASTOID
Dataset Debug Messages
When the JIRA issue(s) present in the dataset have been resolved, and their resolution has been confirmed by governance, please remove them.
This example Trial Sets dataset shows information about the test conditions for set A1 and A2 in this example study. Sets A1 and A2 can be seen in the first and second rows respectively of the sample report Table 1 (above). For brevity, the TX dataset and the findings (GT) dataset do not show information for any other sets. Fully formed datasets for this example study would include information about the test conditions and findings for all sets.
Rows 1-23:
Show trial set parameters and values that comprise the test conditions for trial set A1. Set A1 is the data for the negative control (concentration 0) with short-term exposure and metabolic activation S9. The applicant has chosen to given a long name (SET) equal to "ST+S9_C0".
Set A1 is associated with the first row in the sample report table for study 123.
Rows 24-46:
Show trial set parameters and values that comprise the test conditions for trial set A2. Set A2 is the data for the short-term exposure with metabolic activation S9 at a concentration of 1250 ug/ml. The applicant has chosen to give the set a long name (SET) equal to "ST+S9_C1250".
Set A2 is associated with the second row in the sample report table for study 123.
tx.xpt
tx.xpt
Row
STUDYID
DOMAIN
SETCD
SET
TXSEQ
TXPARMCD
TXPARM
TXVAL
1
123
TX
A1
ST+S9_C0
1
MTACTIND
Metabolic Activating Agent Name
+S9
2
123
TX
A1
ST+S9_C0
2
METACTFL
Presence of Metabolic Activation Flag
Y
3
123
TX
A1
ST+S9_C0
3
IVTDMIN
In vitro Treatment Duration Minimum
3
4
123
TX
A1
ST+S9_C0
4
IVTDTRG
In vitro Treatment Duration Target
3.5
5
123
TX
A1
ST+S9_C0
5
IVTDMAX
In vitro Treatment Duration Maximum
4
6
123
TX
A1
ST+S9_C0
6
IVTDU
In vitro Treatment Duration Unit
HOURS
7
123
TX
A1
ST+S9_C0
7
RCVDMIN
Recovery Duration Minimum
23.5
8
123
TX
A1
ST+S9_C0
8
RCVDTRG
Recovery Duration Target
24
9
123
TX
A1
ST+S9_C0
9
RCVDMAX
Recovery Duration Maximum
24.5
10
123
TX
A1
ST+S9_C0
10
RCVDU
Recovery Duration Unit
HOURS
11
123
TX
A1
ST+S9_C0
11
INCBTMP
Incubation Temperature
37
12
123
TX
A1
ST+S9_C0
12
INCBTMPU
Incubation Temperature Unit
C
13
123
TX
A1
ST+S9_C0
13
ATMRHP
Atmospheric Relative Humidity Percent
50
14
123
TX
A1
ST+S9_C0
14
ATMCO2P
Atmospheric CO2 Percent
5
15
123
TX
A1
ST+S9_C0
15
SPTOBID
Applicant-defined tobacco identifier
CIG01a
16
123
TX
A1
ST+S9_C0
16
EXPTYP
Exposure Type
Submerged
17
123
TX
A1
ST+S9_C0
17
SAMTYP
Sample Type
Total Particulate Matter in DMSO
18
123
TX
A1
ST+S9_CO
18
ITVNAM
Intervention Article Name
Tobacco ProdA
19
123
TX
A1
ST+S9_C0
19
ITVTYPE
Intervention Article Type
Negative Control
20
123
TX
A1
ST+S9_C0
20
ITVCONC
Intervention Article Concentration
0
21
123
TX
A1
ST+S9_C0
21
ITVCONCU
Intervention Article Concentration Unit
ug/ml
22
123
TX
A1
ST+S9_C0
22
SPDEVID
Applicant-defined device identifier
PUFFMASTER3K
23
123
TX
A1
ST+S9_C0
23
SMKRGM
Smoking Regimen
MEDIUM INTENSITY REGIMEN
24
123
TX
A2
ST+S9_C1250
24
MTACTIND
Metabolic Activating Agent Name
+S9
25
123
TX
A2
ST+S9_C1250
25
METACTFL
Presence of Metabolic Activation Flag
Y
26
123
TX
A2
ST+S9_C1250
26
IVTDMIN
In vitro Treatment Duration Minimum
3
27
123
TX
A2
ST+S9_C1250
27
IVTDTRG
In vitro Treatment Duration Target
3.5
28
123
TX
A2
ST+S9_C1250
28
IVTDMAX
In vitro Treatment Duration Maximum
4
29
123
TX
A2
ST+S9_C1250
29
IVTDU
In vitro Treatment Duration Unit
HOURS
30
123
TX
A2
ST+S9_C1250
30
RCVDMIN
Recovery Duration Minimum
23.5
31
123
TX
A2
ST+S9_C1250
31
RCVDTRG
Recovery Duration Target
24
32
123
TX
A2
ST+S9_C1250
32
RCVDMAX
Recovery Duration Maximum
24.5
33
123
TX
A2
ST+S9_C1250
33
RCVDU
Recovery Duration Unit
HOURS
34
123
TX
A2
ST+S9_C1250
34
INCBTMP
Incubation Temperature
37
35
123
TX
A2
ST+S9_C1250
35
INCBTMPU
Incubation Temperature Unit
C
36
123
TX
A2
ST+S9_C1250
36
ATMRHP
Atmospheric Relative Humidity Percent
50
37
123
TX
A2
ST+S9_C1250
37
ATMCO2P
Atmospheric CO2 Percent
5
38
123
TX
A2
ST+S9_C1250
38
SPTOBID
Applicant-defined tobacco identifier
CIG01a
39
123
TX
A2
ST+S9_C1250
39
EXPTYP
Exposure Type
Submerged
40
123
TX
A2
ST+S9_C1250
40
SAMTYP
Sample Type
Total Particulate Matter in DMSO
41
123
TX
A2
ST+S9_C1250
41
ITVNAM
Intervention Article Name
Tobacco ProdA
42
123
TX
A2
ST+S9_C1250
42
ITVTYPE
Intervention Article Type
Product
43
123
TX
A2
ST+S9_C1250
43
ITVCONC
Intervention Article Concentration
1250
44
123
TX
A2
ST+S9_C1250
44
ITVCONCU
Intervention Article Concentration Unit
ug/ml
45
123
TX
A2
ST+S9_C1250
45
SPDEVID
Applicant-defined Device Identifier
PUFFMASTER2023
46
123
TX
A2
ST+S9_C1250
46
SMKRGM
Smoking Regimen
HIGH INTENSITY REGIMEN
$warningHtml
Dataset Wrapper Debug Message
Please add a row column to your dataset.
Row 1:
Shows the value of REFID=C0. This REFID refers to the trial set with a SETCD of "A1", as defined in the TX dataset. LEVEL=1 and LVLDESC="EXPERIMENTAL UNIT/TRIAL SET" indicates this identifier is referring to both the experimental unit and the unit to which the treatment is applied, and to the entire trial set.
Rows 2-5:
Show the values of 4 observational units (C0_Count1 through C0_Count4) that are within the parent experimental unit, REFID=C0. In this example assay, these observational units are also all within the same trial set, as defined in the TX dataset.
Row 6:
Shows the value of REFID=C1250. This REFID refers to the trial set with a SETCD of "A2", as defined in the TX dataset. LEVEL=1 and LVLDESC="EXPERIMENTAL UNIT/TRIAL SET" indicates this identifier is referring to both the experimental unit and the unit to which the treatment is applied, and to the entire trial set.
Rows 7-10:
Show the values of 4 observational units (C1250_Count1 through C1250_Count4) that are within the parent experimental unit, REFID=C1250. In this example assay, these observational units are also all within the same trial set, as defined in the TX dataset.
$titleHtml
relref.xpt
Row
STUDYID
SETCD
REFID
PARENT
LEVEL
LVLDESC
1
123
A1
C0
1
EXPERIMENTAL UNIT/TRIAL SET
2
123
A1
C0-Count1
C0
2
OBSERVATIONAL UNIT
3
123
A1
C0-Count2
C0
2
OBSERVATIONAL UNIT
4
123
A1
C0-Count3
C0
2
OBSERVATIONAL UNIT
5
123
A1
C0-Count4
C0
2
OBSERVATIONAL UNIT
6
123
A2
C1250
1
EXPERIMENTAL UNIT/TRIAL SET
7
123
A2
C1250-Count1
C1250
2
OBSERVATIONAL UNIT
8
123
A2
C1250-Count2
C1250
2
OBSERVATIONAL UNIT
9
123
A2
C1250-Count3
C1250
2
OBSERVATIONAL UNIT
10
123
A2
C1250-Count4
C1250
2
OBSERVATIONAL UNIT
$warningHtml
Dataset Wrapper Debug Message
Please add a row column to your dataset.
Rows 1-3, 8:
Show percentage result values that apply to GTREFID=C0. REFID=C0, as shown in the RELREF dataset, relates this data to the trial set in the first row of table 1 in the sample report table for study 123.
Rows 4-7:
Show the 4 micronucleated cell counts for the observational units with GTREFID from C0-Count1 through C0-Count4, for which their relationship to test conditions (in tx.xpt) and experimental units (in relref.xpt) are shown in the RELREF dataset.
Rows 9-11, 16:
Show percentage result values that apply to GTREFID=C1250. REFID=C1250, as shown in the RELREF dataset, relates this data to the trial set in the second row of table 1 in the sample report table for study 123.
Rows 12-15:
Show the 4 micronucleated cell counts for the observational units with GTREFID from C1250-Count1 through C1250-Count4, for which their relationship to test conditions (in tx.xpt) and experimental units (in relref.xpt) are shown in the RELREF dataset.
gt.xpt
gt.xpt
Row
STUDYID
DOMAIN
GTSEQ
GTREFID
GTTESTCD
GTTEST
GTCELLEV
GTORRES
GTORRESU
GTCOLSRT
GTSTRESC
GTSTRESN
GTSTRESU
GTDTC
1
123
GT
1
C0
RICCTOBA-643
- Jira project doesn't exist or you don't have permission to view it.
Relative Increase in Cell Count
154
0
%
0
0
%
2022-05-25
2
123
GT
2
C0
RCC
Relative Cell Count
154
0
%
0
0
%
2022-05-25
3
123
GT
3
C0
RPD
Relative Population Doubling
154
0
%
0
0
%
2022-05-25
4
123
GT
4
C0-Count1
MNCE
Micronucleated Cells
2205
15
TOBA-756
- Jira project doesn't exist or you don't have permission to view it.
15
15
2022-05-25
5
123
GT
5
C0-Count2
MNCE
Micronucleated Cells
2474
13
13
13
2022-05-25
6
123
GT
6
C0-Count3
MNCE
Micronucleated Cells
2758
17
17
17
2022-05-25
7
123
GT
7
C0-Count4
MNCE
Micronucleated Cells
2669
12
12
12
2022-05-25
8
123
GT
8
C0
MNCECE
Micronucleated Cells/Total Cells
0.57
%
0.57
0.57
%
2022-05-25
9
123
GT
1
C1250
RICC
Relative Increase in Cell Count
134
15.7
%
15.7
15.7
%
2022-05-25
10
123
GT
2
C1250
RCC
Relative Cell Count
134
13.0
%
13.0
13.0
%
2022-05-25
11
123
GT
3
C1250
RPD
Relative Population Doubling
134
7.9
%
7.9
7.9
%
2022-05-25
12
123
GT
4
C1250-Count1
MNCE
Micronucleated Cells
3266
20
20
20
2022-05-25
13
123
GT
5
C1250-Count2
MNCE
Micronucleated Cells
2190
17
17
17
2022-05-25
14
123
GT
6
C1250-Count3
MNCE
Micronucleated Cells
2758
13
13
13
2022-05-25
15
123
GT
7
C1250-Count4
MNCE
Micronucleated Cells
2714
21
21
21
2022-05-25
16
123
GT
8
C1250
MNCECE
Micronucleated Cells/Total Cells
0.66
%
0.66
0.66
%
2022-05-25
Dataset Debug Message
When the JIRA issue(s) present in the dataset have been resolved, and their resolution has been confirmed by governance, please remove them.