This is an example showing example shows a sample report table, trial design, and results data of Study #123 dataset for study 123 for the determination of the in vitro genotoxicity potential of 10 tobacco products in using the in vitro Micronucleus Assay
| Info |
|---|
- red font - indicates potential for CT code lists
- green font - links to other domains
- purple font - to be discussed
|
| Expand |
|---|
| title | Study 123, Report Table |
|---|
|
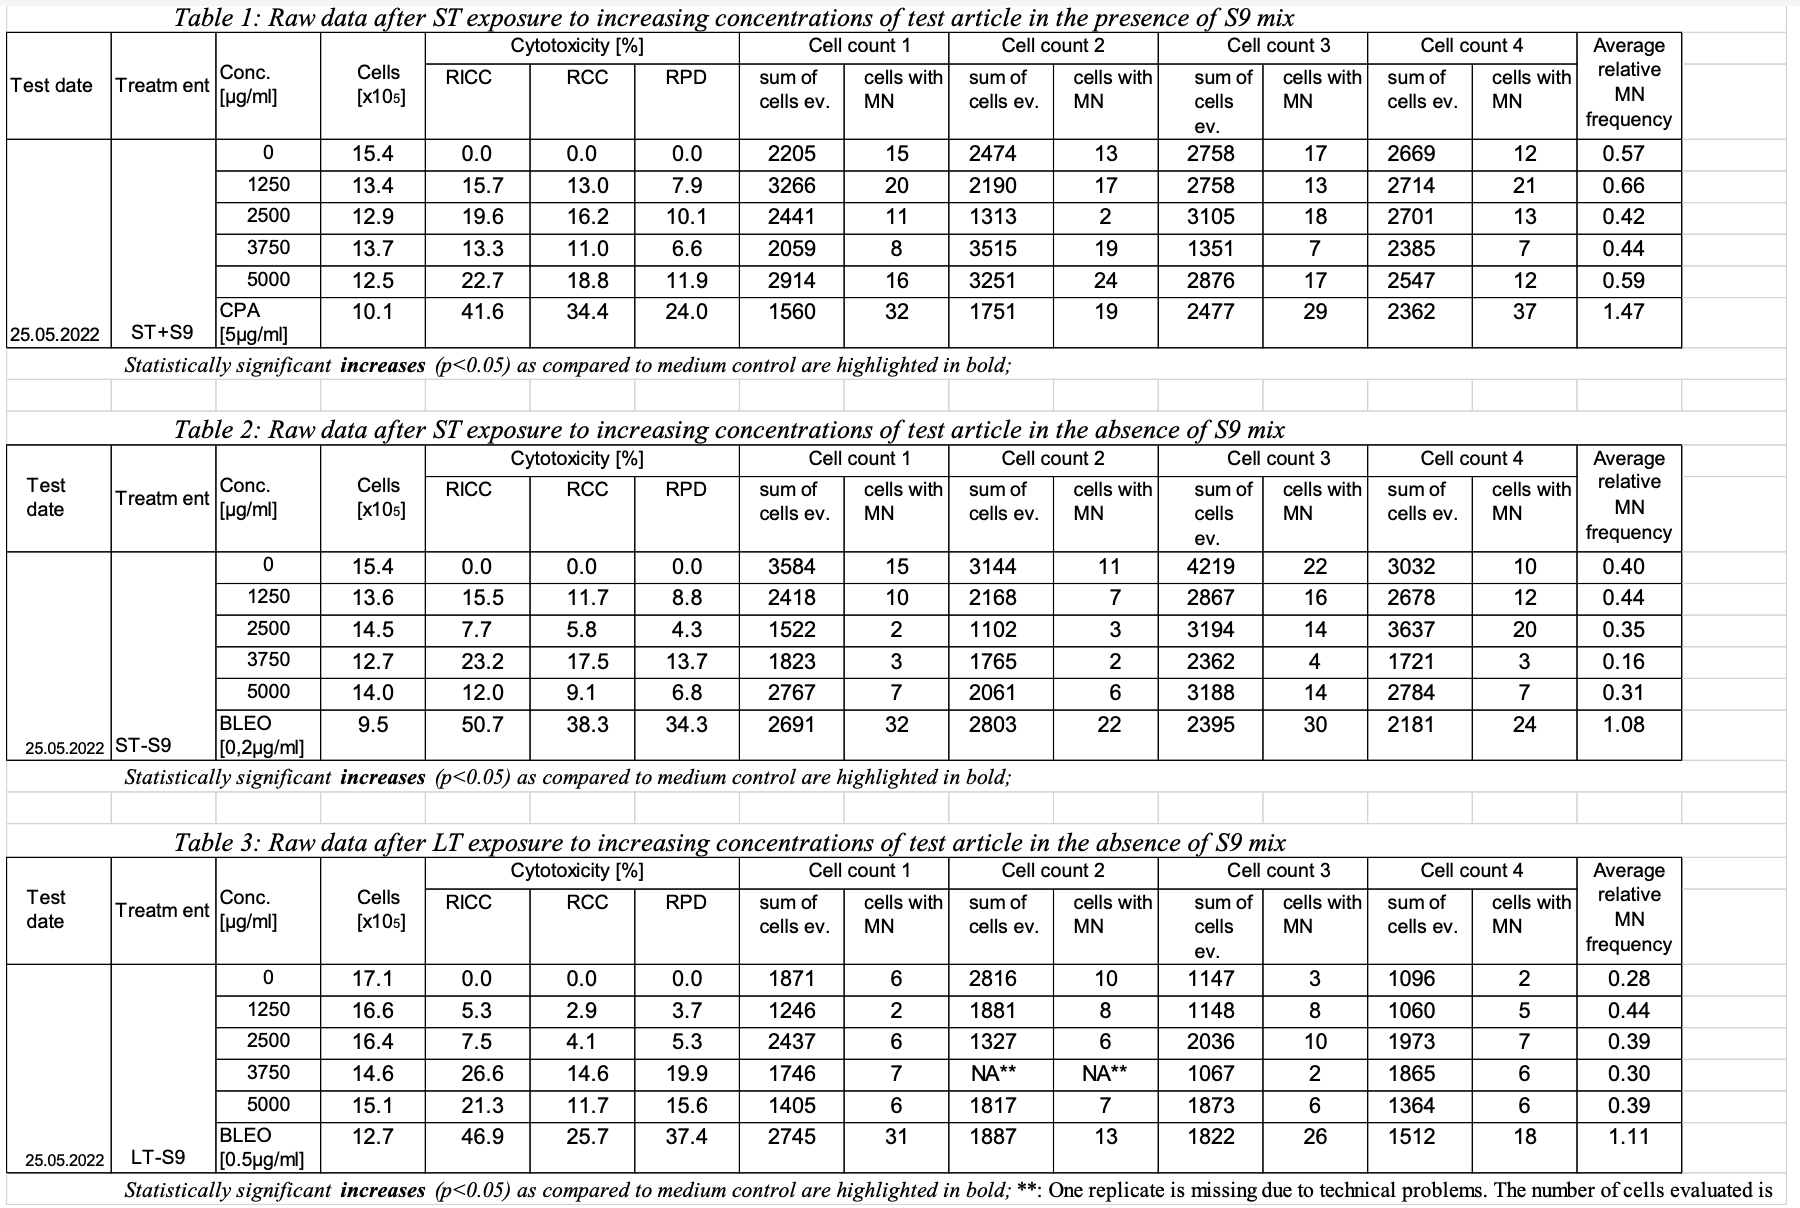 Image Removed Image Removed
|
micronucleus assay.
| Expand |
|---|
| title | Sample Report Table for Study 123 |
|---|
|
Image Added |
| Dataset wrap |
|---|
| Rowcaps |
|---|
| Rows 1-2: | Show 2 records for TSPARMCD = "GLPTYP", using TSSEQ to indicate multiple records, since both GLP types apply for this example study. | | Row 3: | Shows that this study was conducted as a GLP study. | | Rows 4-5: | Show the study start date and study title. | | Rows 6-7: | Show the version of SEND Implementation Guide and version of Controlled Terminology used in this study. | | Row 8: | Shows the applicant's organization. | | Row 9: | Shows that the applicant's study reference ID is not applicable. | | Rows 10-13: | Show that TSGRPID has been used to link records (name, location, country) related to the test facility (TSGRPID = 1). The study director is associated with the test facility. | | Rows 14-16: | Show that TSGRPID (TSGRPID=2) has been used to link the information on the testing guideline followed on this study (TSTGDNAM, TSTGDORG, TSTGDVER). | | Shows the study type for this study. | | Shows that this study includes a Mammalian Cell Micronucleus Assay. | | Rows 19-20: | Show that the species is human and the cell line is TK6 lymphoblastoid in this study. |
|
|
| Expand |
|---|
| title | ts.xpt (trial summary, study level parameters) |
|---|
|
- Assumption: The intent of this dataset is to provide a summary of trial (study) information. This is not subject-level data.
- Assumption: A Trial (study) can have more than one assay type
- Assumption: ASSAYID value of ALL indicates that it applies to all assays in the study
| Row | STUDYID | ASSAYID | DOMAIN | TSSEQ | TSGRPID | TSPARMCD | TSPARM | TSVAL | TSVALNF |
|---|
| 1 | 123 |
|
MNvit | | TS | 1 |
| GLPTYP | Good Laboratory Practice Type | FDA |
| | 2 | 123 |
|
MNvit | | TS | 2 |
| GLPTYP | Good Laboratory Practice Type | OECD |
| | 3 | 123 |
|
MNvit | TS | 1 |
| STSTDTC | Study Start Date | 2022-05-25 |
|
4MNvit | | TS | 1 |
| STITLE | Study Title | Determination of the in vitro genotoxicity potential |
|
of 10 tobacco products in the in vitro Micronucleus Assayusing the in vitro Neutral Red Uptake assay |
| | 6 | 123 |
|
5 | 123 | MNvit | TS | 1 |
| SNDIGVER | SEND Implementation Guide Version | TOBACCO IMPLEMENTATION GUIDE VERSION 1.0 |
|
6MNvit | TS | 1 |
| SNDCTVER | SEND Controlled Terminology Version | SEND Terminology 2021-09-30 |
|
7MNvitSSPONSORSponsor Organization Sponsor 8MNvitSPREFIDSponsor's | Study Reference ID |
| NOT APPLICABLE |
|
9MNvit | | TS | 1 | 1 | TSTFNAM | Test Facility Name | Example |
|
Tox 10MNvit | TS | 1 | 1 | TSTFLOC | Test Facility Location | 10 Somewhere Street, Montgomery, AL 10000 |
|
11MNvit | TS | 1 | 1 | TFCNTRY | Test Facility Country | USA |
|
12MNvit | TS | 1 | 1 | STDIR | Study Director | Dr. R. Smith |
|
13MNvitGLPFL | GLP Flag | Y | | TSTGDNAM | Testing Guideline Name | GUIDELINE FOR THE TESTING OF CHEMICALS No. 487 |
| | 15 |
|
14MNvit | ASTD | Assay Standard| TSTGDORG | Testing Guideline Organization | OECD |
|
Test No. 487 15MNvitASTDVAssay Standard | Testing Guideline Version |
|
2016072916MNvit | | TS | 1 |
| SSTYP | Study Type | GENOTOXICITY IN VITRO |
|
17MNvitSSSTYP | Study Sub Type | In Vitro Micronucleus |
| GNTXAID | Genetic Toxicology Assay Identifier | MNvit |
| | 19 |
|
18MNvit | Homo Sapiens19MNvit?? | Test System? | TK6 Lymphoblastoid Suspension Cells |
|---|
| Expand |
|---|
|
|
This example Trial Sets dataset shows information about the test conditions for set A1 and A2 in this example study. Sets A1 and A2 can be seen in the first and second rows respectively of the sample report Table 1 (above). For brevity, the TX dataset and the findings (GT) dataset do not show information for any other sets. Fully formed datasets for this example study would include information about the test conditions and findings for all sets.
| Dataset wrap |
|---|
|
| Rowcaps |
|---|
| Rows 1-23: | Show trial set parameters and values that comprise the test conditions for trial set A1. Set A1 is the data for the negative control (concentration 0) with short-term exposure and metabolic activation S9. The applicant has chosen to given a long name (SET) equal to "ST+S9_C0". Set A1 is associated with the first row in the sample report table for study 123. | | Rows 24-46: | Show trial set parameters and values that comprise the test conditions for trial set A2. Set A2 is the data for the short-term exposure with metabolic activation S9 at a concentration of 1250 ug/ml. The applicant has chosen to give the set a long name (SET) equal to "ST+S9_C1250". Set A2 is associated with the second row in the sample report table for study 123. |
|
- During CT definition/reviews will decide appropriate TXPARM and TXVAL; Treatment duration may be controlled; For now, we just include good example values based on our experience
- Assumption: The Trial Sets (TX) domain provides the list of distinct sets of subjects having different experimental factors, treatment factors, inherent characteristics, or distinct sponsor designations as specified in the trial design.
- Where is TK6 cell type? is this test system (see below)
- needs to be allowed to vary down to the well level / result level
A1:  Image Removed Image Removed A2:  Image Removed Image Removed | Row | STUDYID | ASSAYID | DOMAIN | SETCD | | TXSEQ | TXPARMCD | TXPARM | TXVAL |
|---|
| 1 | 123 |
|
MNvit(table 1, row 1, ST exposure with S9)
METACT | Metabolic Activation (should there be two parms? Presence, type)? | +S9 | METACTFL | Y/N presence of metabolic activation | 123 | MNvit | TX | A1 | TRTDRTRG | Treatment Duration target. (how do we show 3-6 hour range? start/end, target and tolerance?, one text field not-analyzable) | 3 | 123 | MNvit | TX | A1 | TRTDRTOL | Treatment Duration Tolerance | 123 | MNvit | TX | A1 | TRTDURU | Treatment Duration Unit (this is for both TRTDURT, TRTDURTOL) | H | 123 | MNvit | TX | A1 | INTRVN | name of the intervention article (Tobacco ProdA, Bleomycin or Cyclophosphamid A) | Tobacco ProdA | 123 | MNvit | TX | A1 | ITVTYPE | type of intervention article choices of values: product; negative control; positive control | Product | 123 | MNvit | TX | A1 | ITVCONC | Concentration of intervention article | 0 | 123 | MNvit | TX | A1 | ITVCONCU | Concentration Unit | ug/ml | 123 | MNvit | TX | A2 (table 1, row 2) | METACT | Metabolic Activation (should there be two parms? Presence, type)? | +S9 | 123 | MNvit | TX | A2 | TRTDRTRG | Treatment Duration target. (how do we show 3-6 hour range? start/end, target and tolerance?, one text field not-analyzable) | 3 | 123 | MNvit | TX | A2 | TRTDRTOL | Treatment Duration Tolerance | 123 | MNvit | TX | A2 | TRTDURU | Treatment Duration Unit (this is for both TRTDURT, TRTDURTOL) | H | 123 | MNvit | TX | A2 | INTRVN | name of the intervention article | Tobacco ProdA | 123 | MNvit | TX | A2 | ITVTYPE | type of intervention article | Product | 123 | MNvit | TX | A2 | ITVCONC | Concentration of i a | 1250 | 123 | MNvit | TX | A2 | ITVCONCU | Concentration Unit | ug/ml | ... | | ST+S9_C0 | 1 | MTACTIND | Metabolic Activating Agent Name | +S9 | | 2 | 123 | TX | A1 | ST+S9_C0 | 2 | METACTFL | Presence of Metabolic Activation Flag | Y | | 3 | 123 | TX | A1 | ST+S9_C0 | 3 | IVTDMIN | In vitro Treatment Duration Minimum | 3 | | 4 | 123 | TX | A1 | ST+S9_C0 | 4 | IVTDTRG | In vitro Treatment Duration Target | 3.5 | | 5 | 123 | TX | A1 | ST+S9_C0 | 5 | IVTDMAX | In vitro Treatment Duration Maximum | 4 | | 6 | 123 | TX | A1 | ST+S9_C0 | 6 | IVTDU | In vitro Treatment Duration Unit | HOURS | | 7 | 123 | TX | A1 | ST+S9_C0 | 7 | RCVDMIN | Recovery Duration Minimum | 23.5 | | 8 | 123 | TX | A1 | ST+S9_C0 | 8 | RCVDTRG | Recovery Duration Target | 24 | | 9 | 123 | TX | A1 | ST+S9_C0 | 9 | RCVDMAX | Recovery Duration Maximum | 24.5 | | 10 | 123 | TX | A1 | ST+S9_C0 | 10 | RCVDU | Recovery Duration Unit | HOURS | | 11 | 123 | TX | A1 | ST+S9_C0 | 11 | INCBTMP | Incubation Temperature | 37 | | 12 | 123 | TX | A1 | ST+S9_C0 | 12 | INCBTMPU | Incubation Temperature Unit | C | | 13 | 123 | TX | A1 | ST+S9_C0 | 13 | ATMRHP | Atmospheric Relative Humidity Percent | 50 | | 14 | 123 | TX | A1 | ST+S9_C0 | 14 | ATMCO2P | Atmospheric CO2 Percent | 5 | | 15 | 123 | TX | A1 | ST+S9_C0 | 15 | SPTOBID | Applicant-defined tobacco identifier | CIG01a | | 16 | 123 | TX | A1 | ST+S9_C0 | 16 | EXPTYP | | Submerged | | 17 | 123 | TX | A1 | ST+S9_C0 | 17 | SAMTYP | Sample Type | Total Particulate Matter in DMSO | | 18 | 123 | TX | A1 | ST+S9_CO | 18 | ITVNAM | Intervention Article Name | Tobacco ProdA | | 19 | 123 | TX | A1 | ST+S9_C0 | 19 | ITVTYPE | Intervention Article Type | Negative Control | | 20 | 123 | TX | A1 | ST+S9_C0 | 20 | ITVCONC | Intervention Article Concentration | 0 | | 21 | 123 | TX | A1 | ST+S9_C0 | 21 | ITVCONCU | Intervention Article Concentration Unit | ug/ml | | 22 | 123 | TX | A1 | ST+S9_C0 | 22 | SPDEVID | Applicant-defined device identifier | PUFFMASTER3K | | 23 | 123 | TX | A1 | ST+S9_C0 | 23 | SMKRGM | Smoking Regimen | MEDIUM INTENSITY REGIMEN | | 24 | 123 | TX | A2 | ST+S9_C1250 | 24 | MTACTIND | Metabolic Activating Agent Name | +S9 | | 25 | 123 | TX | A2 | ST+S9_C1250 | 25 | METACTFL | Presence of Metabolic Activation Flag | Y | | 26 | 123 | TX | A2 | ST+S9_C1250 | 26 | IVTDMIN | In vitro Treatment Duration Minimum | 3 | | 27 | 123 | TX | A2 | ST+S9_C1250 | 27 | IVTDTRG | In vitro Treatment Duration Target | 3.5 | | 28 | 123 | TX | A2 | ST+S9_C1250 | 28 | IVTDMAX | In vitro Treatment Duration Maximum | 4 | | 29 | 123 | TX | A2 | ST+S9_C1250 | 29 | IVTDU | In vitro Treatment Duration Unit | HOURS | | 30 | 123 | TX | A2 | ST+S9_C1250 | 30 | RCVDMIN | Recovery Duration Minimum | 23.5 | | 31 | 123 | TX | A2 | ST+S9_C1250 | 31 | RCVDTRG | Recovery Duration Target | 24 | | 32 | 123 | TX | A2 | ST+S9_C1250 | 32 | RCVDMAX | Recovery Duration Maximum | 24.5 | | 33 | 123 | TX | A2 | ST+S9_C1250 | 33 | RCVDU | Recovery Duration Unit | HOURS | | 34 | 123 | TX | A2 | ST+S9_C1250 | 34 | INCBTMP | Incubation Temperature | 37 | | 35 | 123 | TX | A2 | ST+S9_C1250 | 35 | INCBTMPU | Incubation Temperature Unit | C | | 36 | 123 | TX | A2 | ST+S9_C1250 | 36 | ATMRHP | Atmospheric Relative Humidity Percent | 50 | | 37 | 123 | TX | A2 | ST+S9_C1250 | 37 | ATMCO2P | Atmospheric CO2 Percent | 5 | | 38 | 123 | TX | A2 | ST+S9_C1250 | 38 | SPTOBID | Applicant-defined tobacco identifier | CIG01a | | 39 | 123 | TX | A2 | ST+S9_C1250 | 39 | EXPTYP | | Submerged | | 40 | 123 | TX | A2 | ST+S9_C1250 | 40 | SAMTYP | Sample Type | Total Particulate Matter in DMSO | | 41 | 123 | TX | A2 | ST+S9_C1250 | 41 | ITVNAM | Intervention Article Name | Tobacco ProdA | | 42 | 123 | TX | A2 | ST+S9_C1250 | 42 | ITVTYPE | Intervention Article Type | Product | | 43 | 123 | TX | A2 | ST+S9_C1250 | 43 | ITVCONC | Intervention Article Concentration | 1250 | | 44 | 123 | TX | A2 | ST+S9_C1250 | 44 | ITVCONCU | Intervention Article Concentration Unit | ug/ml | | 45 | 123 | TX | A2 | ST+S9_C1250 | 45 | SPDEVID | Applicant-defined Device Identifier | PUFFMASTER2023 | | 46 | 123 | TX | A2 | ST+S9_C1250 | 46 | SMKRGM | Smoking Regimen | HIGH INTENSITY REGIMEN |
|
|---|
| Dataset wrap |
|---|
|
| Rowcaps |
|---|
| Row 1: | Shows the value of REFID=C0. This REFID refers to the trial set with a SETCD of "A1", as defined in the TX dataset. LEVEL=1 and LVLDESC="EXPERIMENTAL UNIT/TRIAL SET" indicates this identifier is referring to both the experimental unit and the unit to which the treatment is applied, and to the entire trial set. | | Rows 2-5: | Show the values of 4 observational units (C0_Count1 through C0_Count4) that are within the parent experimental unit, REFID=C0. In this example assay, these observational units are also all within the same trial set, as defined in the TX dataset. | | Row 6: | Shows the value of REFID=C1250. This REFID refers to the trial set with a SETCD of "A2", as defined in the TX dataset. LEVEL=1 and LVLDESC="EXPERIMENTAL UNIT/TRIAL SET" indicates this identifier is referring to both the experimental unit and the unit to which the treatment is applied, and to the entire trial set. | | Rows 7-10: | Show the values of 4 observational units (C1250_Count1 through C1250_Count4) that are within the parent experimental unit, REFID=C1250. In this example assay, these observational units are also all within the same trial set, as defined in the TX dataset. |
|
| Dataset2 |
|---|
| Row | STUDYID | SETCD | REFID | PARENT | LEVEL | LVLDESC |
|---|
1 | 123 | | C0 |
| 1 | EXPERIMENTAL UNIT/TRIAL SET | 2 | 123 | A1 | C0-Count1 | C0 | 2 | OBSERVATIONAL UNIT | 3 | 123 | A1 | C0-Count2 | C0 | 2 | OBSERVATIONAL UNIT | 4 | 123 | A1 | C0-Count3 | C0 | 2 | OBSERVATIONAL UNIT | 5 | 123 | A1 | C0-Count4 | C0 | 2 | OBSERVATIONAL UNIT | 6 | 123 | A2 | C1250 |
| 1 | EXPERIMENTAL UNIT/TRIAL SET | | 7 | 123 | A2 | C1250-Count1 | C1250 | 2 | OBSERVATIONAL UNIT | | 8 | 123 | A2 | C1250-Count2 | C1250 | 2 | OBSERVATIONAL UNIT | | 9 | 123 | A2 | C1250-Count3 | C1250 | 2 | OBSERVATIONAL UNIT | | 10 | 123 | A2 | C1250-Count4 | C1250 | 2 | OBSERVATIONAL UNIT |
|
|
| Dataset wrap |
|---|
|
| Rowcaps |
|---|
Rows 1-3, 8: | Show percentage result values that apply to GTREFID=C0. REFID=C0, as shown in the RELREF dataset, relates this data to the trial set in the first row of table 1 in the sample report table for study 123. | | Rows 4-7: | Show the 4 micronucleated cell counts for the observational units with GTREFID from C0-Count1 through C0-Count4, for which their relationship to test conditions (in tx.xpt) and experimental units (in relref.xpt) are shown in the RELREF dataset. | Rows 9-11, 16: | Show percentage result values that apply to GTREFID=C1250. REFID=C1250, as shown in the RELREF dataset, relates this data to the trial set in the second row of table 1 in the sample report table for study 123. | | Rows 12-15: | Show the 4 micronucleated cell counts for the observational units with GTREFID from C1250-Count1 through C1250-Count4, for which their relationship to test conditions (in tx.xpt) and experimental units (in relref.xpt) are shown in the RELREF dataset. |
|
|
| Expand |
|---|
| title | gt.xpt (similar to LB) |
|---|
|
A1: Image Removed A2: Image Removed | Row | STUDYID | ASSAYID | DOMAIN | TXSETCD | GTSEQ | GTTESTCD | GTTEST | GTCELLEV
(cells evaluated) | GTORRES | GTORRESU | | Dataset2 |
|---|
| Row | STUDYID | DOMAIN | GTSEQ | GTREFID | GTTESTCD | GTTEST | GTCELLEV | GTORRES | GTORRESU | GTCOLSRT |
|---|
|
| GTSTRESC | GTSTRESN | GTSTRESU | GTDTC |
|---|
| 1 | 123 |
|
MNvitA11| C0 | | Relative Increase in Cell Count |
|
0MNvitA12| C0 | RCC | Relative Cell Count | 154 | 0 | % |
| 0 | 0 | % | 2022-05-25 | | 3 | 123 |
|
MNvitA13| C0 | RPD | Relative Population Doubling | 154 | 0 | % |
| 0 | 0 | % | 2022-05-25 | | 4 | 123 |
|
MNvitA14MNCELLS| MNCE | Micronucleated Cells | 2205 | 15 |
|
CellsCellsMNvitA15MNCELLS| MNCE | Micronucleated Cells | 2474 | 13 |
|
Cells | CellsMNvitA16MNCELLS| MNCE | Micronucleated Cells | 2758 | 17 |
|
CellsCellsMNvitA17MNCELLS| MNCE | Micronucleated Cells | 2669 | 12 |
|
Cells | CellsMNvitA18AVGREL | Average Relative MN Frequency| MNCECE | Micronucleated Cells/Total Cells |
| 0.57 | % |
| 0.57 | 0.57 | % | 2022-05-25 | | 9 | 123 |
|
MNvit | A21| C1250 | RICC | Relative Increase in Cell Count | 134 | 15.7 | % |
| 15.7 | 15.7 | % | 2022-05-25 | | 10 | 123 |
|
MNvitA22| C1250 | RCC | Relative Cell Count | 134 | 13.0 | % |
| 13.0 | 13.0 | % | 2022-05-25 | | 11 | 123 |
|
MNvitA23| C1250 | RPD | Relative Population Doubling | 134 | 7.9 | % |
| 7.9 | 7.9 | % | 2022-05-25 | | 12 | 123 |
|
MNvitA24MNCELLS| MNCE | Micronucleated Cells | 3266 | 20 |
|
CellsCellsMNvitA25MNCELLS| MNCE | Micronucleated Cells | 2190 | 17 |
|
Cells | Cells | MNvit | A26MNCELLS| MNCE | Micronucleated Cells | 2758 | 13 |
|
CellsCellsMNvit | A27MNCELLS| MNCE | Micronucleated Cells | 2714 | 21 |
|
CellsCellsMNvitA28AVGREL | | MNCECE | Micronucleated Cells/Total Cells |
|
Average Relative MN Frequency...
|---|