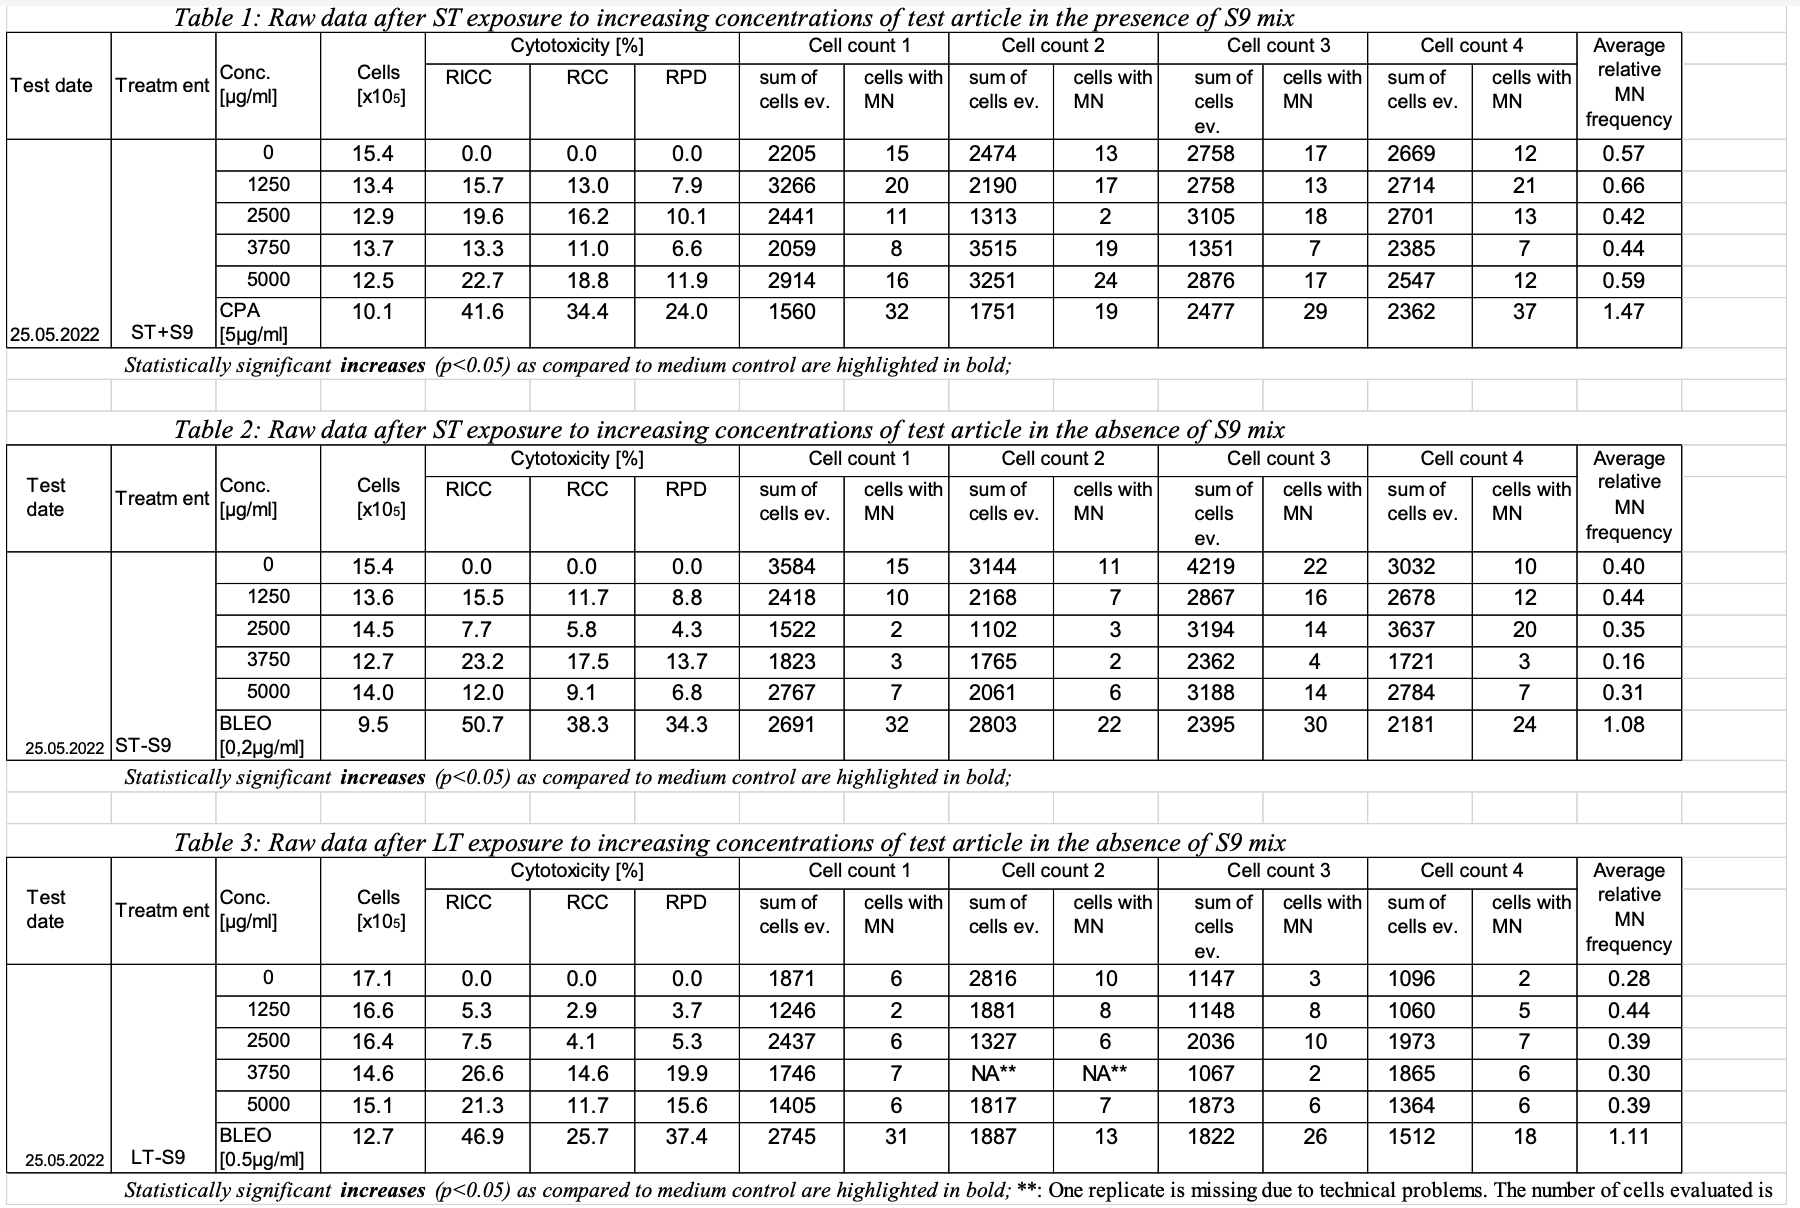
This example shows a sample report table, trial design, and results dataset for study 123 for the determination of the in vitro genotoxicity potential of tobacco products using the in vitro micronucleus assay. | Jira |
|---|
| showSummary | false |
|---|
| server | Issue Tracker (JIRA) |
|---|
| serverId | 85506ce4-3cb3-3d91-85ee-f633aaaf4a45 |
|---|
| key | TOBA-642 |
|---|
|
| Expand |
|---|
| title | Sample Report Table for Study 123 |
|---|
|
|
...
| Dataset wrap |
|---|
|
| Rowcaps |
|---|
Rows 1-3, 8: | Show percentage result values that apply to GTREFID=C0. REFID=C0, as shown in the RELREF dataset, relates this data to the trial set in the first row of table 1 in the sample report table for study 123. | | Rows 4-7: | Show the 4 micronucleated cell counts for the observational units with GTREFID from C0-Count1 through C0-Count4, for which their relationship to test conditions (in tx.xpt) and experimental units (in relref.xpt) are shown in the RELREF dataset. | Rows 9-11, 16: | Show percentage result values that apply to GTREFID=C1250. REFID=C1250, as shown in the RELREF dataset, relates this data to the trial set in the second row of table 1 in the sample report table for study 123. | | Rows 12-15: | Show the 4 micronucleated cell counts for the observational units with GTREFID from C1250-Count1 through C1250-Count4, for which their relationship to test conditions (in tx.xpt) and experimental units (in relref.xpt) are shown in the RELREF dataset. |
|
| Dataset2 |
|---|
| Row | STUDYID | DOMAIN | GTSEQ | GTREFID | GTTESTCD | GTTEST | GTCELLEV | GTORRES | GTORRESU | GTCOLSRT | GTSTRESC | GTSTRESN | GTSTRESU | GTDTC |
|---|
| 1 | 123 | GT | 1 | C0 | RICC| Jira |
|---|
| showSummary | false |
|---|
| server | Issue Tracker (JIRA) |
|---|
| serverId | 85506ce4-3cb3-3d91-85ee-f633aaaf4a45 |
|---|
key | TOBA-643 | Relative Increase in Cell Count | 154 | 0 | % |
| 0 | 0 | % | 2022-05-25 | | 2 | 123 | GT | 2 | C0 | RCC | Relative Cell Count | 154 | 0 | % |
| 0 | 0 | % | 2022-05-25 | | 3 | 123 | GT | 3 | C0 | RPD | Relative Population Doubling | 154 | 0 | % |
| 0 | 0 | % | 2022-05-25 | | 4 | 123 | GT | 4 | C0-Count1 | MNCE | Micronucleated Cells | 2205 | 15 | |
| 15 | 15 |
| 2022-05-25 | | 5 | 123 | GT | 5 | C0-Count2 | MNCE | Micronucleated Cells | 2474 | 13 |
|
| 13 | 13 |
| 2022-05-25 | | 6 | 123 | GT | 6 | C0-Count3 | MNCE | Micronucleated Cells | 2758 | 17 |
|
| 17 | 17 |
| 2022-05-25 | | 7 | 123 | GT | 7 | C0-Count4 | MNCE | Micronucleated Cells | 2669 | 12 |
|
| 12 | 12 |
| 2022-05-25 | | 8 | 123 | GT | 8 | C0 | MNCECE | Micronucleated Cells/Total Cells |
| 0.57 | % |
| 0.57 | 0.57 | % | 2022-05-25 | | 9 | 123 | GT | 1 | C1250 | RICC | Relative Increase in Cell Count | 134 | 15.7 | % |
| 15.7 | 15.7 | % | 2022-05-25 | | 10 | 123 | GT | 2 | C1250 | RCC | Relative Cell Count | 134 | 13.0 | % |
| 13.0 | 13.0 | % | 2022-05-25 | | 11 | 123 | GT | 3 | C1250 | RPD | Relative Population Doubling | 134 | 7.9 | % |
| 7.9 | 7.9 | % | 2022-05-25 | | 12 | 123 | GT | 4 | C1250-Count1 | MNCE | Micronucleated Cells | 3266 | 20 |
|
| 20 | 20 |
| 2022-05-25 | | 13 | 123 | GT | 5 | C1250-Count2 | MNCE | Micronucleated Cells | 2190 | 17 |
|
| 17 | 17 |
| 2022-05-25 | | 14 | 123 | GT | 6 | C1250-Count3 | MNCE | Micronucleated Cells | 2758 | 13 |
|
| 13 | 13 |
| 2022-05-25 | | 15 | 123 | GT | 7 | C1250-Count4 | MNCE | Micronucleated Cells | 2714 | 21 |
|
| 21 | 21 |
| 2022-05-25 | | 16 | 123 | GT | 8 | C1250 | MNCECE | Micronucleated Cells/Total Cells |
| 0.66 | % |
| 0.66 | 0.66 | % | 2022-05-25 |
|
|