This example shows a sample report table, trial design, and results dataset for study 123 for the determination of the in vitro genotoxicity potential of tobacco products using the in vitro micronucleus assay. | Jira |
|---|
| showSummary | false |
|---|
| server | Issue Tracker (JIRA) |
|---|
| serverId | 85506ce4-3cb3-3d91-85ee-f633aaaf4a45 |
|---|
key | TOBA-642| Expand |
|---|
| title | Sample Report Table for Study 123 |
|---|
|
|
...
...
| Dataset wrap |
|---|
| Rowcaps |
|---|
| Rows 1-2: | Show 2 records for TSPARMCD = "GLPTYP", using TSSEQ to indicate multiple records, since both GLP types apply for this example study. | | Row 3: | Shows that this study was conducted as a GLP study. | | Rows 4-5: | Show the study start date and study title. | | Rows 6-7: | Show the version of SEND Implementation Guide and version of Controlled Terminology used in this study. | | Row 8: | Shows the applicant's organization. | | Row 9: | Shows that the applicant's study reference ID is not applicable. | | Rows 10-13: | Show that TSGRPID has been used to link records (name, location, country) related to the test facility (TSGRPID = 1). The study director is associated with the test facility. | | Rows 14-16: | Show that TSGRPID (TSGRPID=2) has been used to link the information on the testing guideline followed on this study (TSTGDNAM, TSTGDORG, TSTGDVER). | | Shows the study type for this study. | | Shows that this study includes a Mammalian Cell Micronucleus Assay. | | Rows 19-20: | Show that the species is human and the cell line is TK6 lymphoblastoid in this study. |
|
| Dataset2 |
|---|
| Row | STUDYID | DOMAIN | TSSEQ | TSGRPID | TSPARMCD | TSPARM | TSVAL | TSVALNF |
|---|
| 1 | 123 | TS | 1 |
| GLPTYP | Good Laboratory Practice Type | FDA |
| | 2 | 123 | TS | 2 |
| GLPTYP | Good Laboratory Practice Type | OECD |
| | 3 | 123 | TS | 1 |
| GLPFL | GLP Flag | Y |
| | 4 | 123 | TS | 1 |
| STSTDTC | Study Start Date | 2022-05-25 |
| | 5 | 123 | TS | 1 |
| STITLE | Study Title | Determination of the in vitro genotoxicity potential using the in vitro Neutral Red Uptake assay |
| | 6 | 123 | TS | 1 |
| SNDIGVER | SEND Implementation Guide Version | TOBACCO IMPLEMENTATION GUIDE VERSION 1.0 |
| | 7 | 123 | TS | 1 |
| SNDCTVER | SEND Controlled Terminology Version | SEND Terminology 2021-09-30 |
| | 8 | 123 | TS | 1 |
| APPLCNT | Applicant Organization| Jira |
|---|
| showSummary | false |
|---|
| server | Issue Tracker (JIRA) |
|---|
| serverId | 85506ce4-3cb3-3d91-85ee-f633aaaf4a45 |
|---|
| key | TOBA-356 |
|---|
| | Example Applicant, Inc. |
| | 9 | 123 | TS | 1 |
| APREFID | Study Reference ID |
| NOT APPLICABLE | | 10 | 123 | TS | 1 | 1 | TSTFNAM | Test Facility Name | Example Test Lab Name |
| | 11 | 123 | TS | 1 | 1 | TSTFLOC | Test Facility Location | 10 Somewhere Street, Montgomery, AL 10000 |
| | 12 | 123 | TS | 1 | 1 | TFCNTRY | Test Facility Country | USA |
| | 13 | 123 | TS | 1 | 1 | STDIR | Study Director | Dr. R. Smith |
| | 14 | 123 | TS | 1 | 2 | TSTGDNAM | Testing Guideline Name | GUIDELINE FOR THE TESTING OF CHEMICALS No. 487 |
| | 15 | 123 | TS | 1 | 2 | TSTGDORG | Testing Guideline Organization | OECD |
| | 16 | 123 | TS | 1 | 2 | TSTGDVER | Testing Guideline Version | 29-July-2016 |
| | 17 | 123 | TS | 1 |
| SSTYP | Study Type | GENOTOXICITY IN VITRO |
| | 18 | 123 | TS | 1 |
| GNTXAID | Genetic Toxicology Assay Identifier | MNvit |
| | 19 | 123 | TS | 1 |
| SPECIES | Species | HUMAN |
| | 20 | 123 | TS | 1 |
| CELLLN | Cell Line | |
|
|
|
...
| Dataset wrap |
|---|
|
| Rowcaps |
|---|
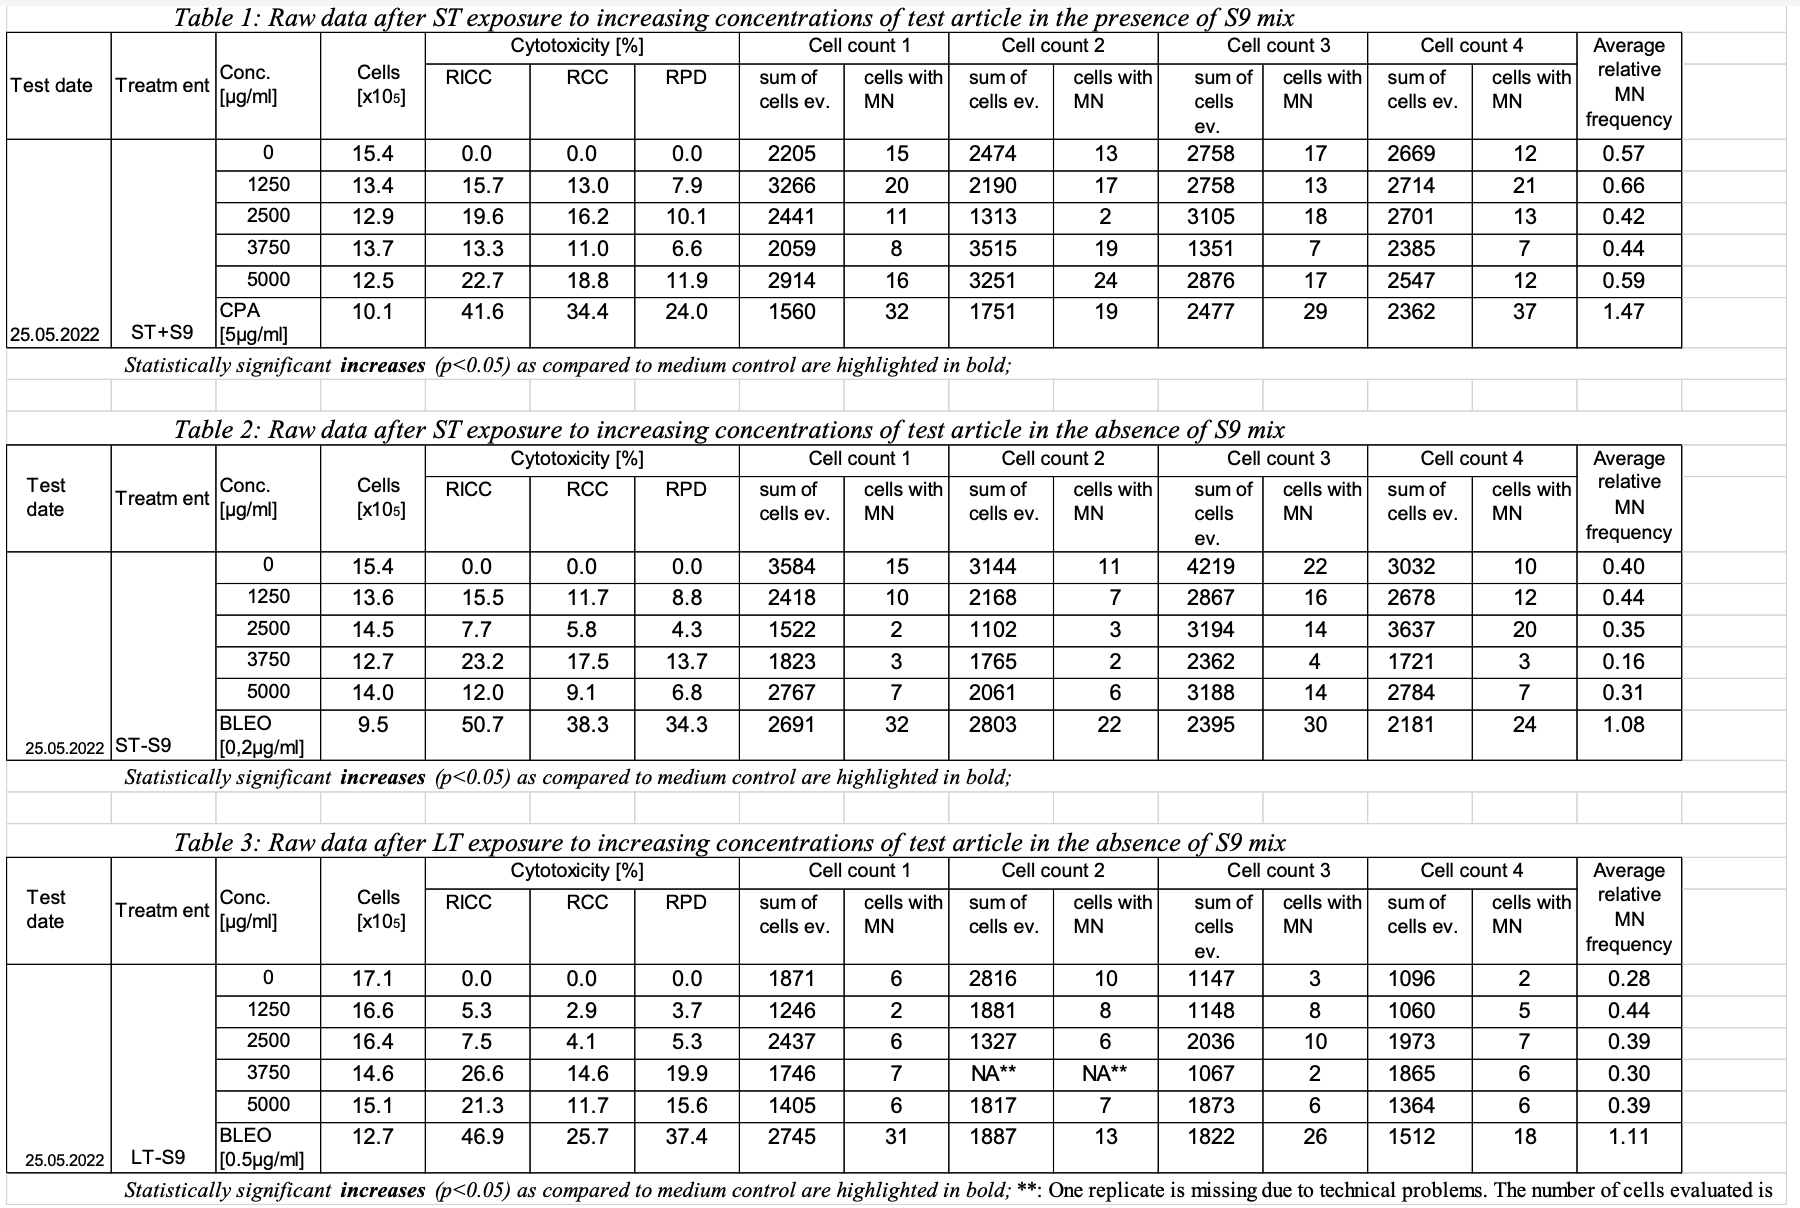
Rows 1-3, 8: | Show percentage result values that apply to GTREFID=C0. REFID=C0, as shown in the RELREF dataset, relates this data to the trial set in the first row of table 1 in the sample report table for study 123. | | Rows 4-7: | Show the 4 micronucleated cell counts for the observational units with GTREFID from C0-Count1 through C0-Count4, for which their relationship to test conditions (in tx.xpt) and experimental units (in relref.xpt) are shown in the RELREF dataset. | Rows 9-11, 16: | Show percentage result values that apply to GTREFID=C1250. REFID=C1250, as shown in the RELREF dataset, relates this data to the trial set in the second row of table 1 in the sample report table for study 123. | | Rows 12-15: | Show the 4 micronucleated cell counts for the observational units with GTREFID from C1250-Count1 through C1250-Count4, for which their relationship to test conditions (in tx.xpt) and experimental units (in relref.xpt) are shown in the RELREF dataset. |
|
| Dataset2 |
|---|
| Row | STUDYID | DOMAIN | GTSEQ | GTREFID | GTTESTCD | GTTEST | GTCELLEV | GTORRES | GTORRESU | GTCOLSRT | GTSTRESC | GTSTRESN | GTSTRESU | GTDTC |
|---|
| 1 | 123 | GT | 1 | C0 | | 1 | 123 | GT | 1 | C0 | RICC| Jira |
|---|
| showSummary | false |
|---|
| server | Issue Tracker (JIRA) |
|---|
| serverId | 85506ce4-3cb3-3d91-85ee-f633aaaf4a45 |
|---|
key | TOBA-643 | Relative Increase in Cell Count | 154 | 0 | % |
| 0 | 0 | % | 2022-05-25 | | 2 | 123 | GT | 2 | C0 | RCC | Relative Cell Count | 154 | 0 | % |
| 0 | 0 | % | 2022-05-25 | | 3 | 123 | GT | 3 | C0 | RPD | Relative Population Doubling | 154 | 0 | % |
| 0 | 0 | % | 2022-05-25 | | 4 | 123 | GT | 4 | C0-Count1 | MNCE | Micronucleated Cells | 2205 | 15| Jira |
|---|
| | showSummary | false |
|---|
| server | Issue Tracker (JIRA) |
|---|
| serverId | 85506ce4-3cb3-3d91-85ee-f633aaaf4a45 |
|---|
key | TOBA-756 |
| 15 | 15 |
| 2022-05-25 | | 5 | 123 | GT | 5 | C0-Count2 | MNCE | Micronucleated Cells | 2474 | 13 |
|
| 13 | 13 |
| 2022-05-25 | | 6 | 123 | GT | 6 | C0-Count3 | MNCE | Micronucleated Cells | 2758 | 17 |
|
| 17 | 17 |
| 2022-05-25 | | 7 | 123 | GT | 7 | C0-Count4 | MNCE | Micronucleated Cells | 2669 | 12 |
|
| 12 | 12 |
| 2022-05-25 | | 8 | 123 | GT | 8 | C0 | MNCECE | Micronucleated Cells/Total Cells |
| 0.57 | % |
| 0.57 | 0.57 | % | 2022-05-25 | | 9 | 123 | GT | 1 | C1250 | RICC | Relative Increase in Cell Count | 134 | 15.7 | % |
| 15.7 | 15.7 | % | 2022-05-25 | | 10 | 123 | GT | 2 | C1250 | RCC | Relative Cell Count | 134 | 13.0 | % |
| 13.0 | 13.0 | % | 2022-05-25 | | 11 | 123 | GT | 3 | C1250 | RPD | Relative Population Doubling | 134 | 7.9 | % |
| 7.9 | 7.9 | % | 2022-05-25 | | 12 | 123 | GT | 4 | C1250-Count1 | MNCE | Micronucleated Cells | 3266 | 20 |
|
| 20 | 20 |
| 2022-05-25 | | 13 | 123 | GT | 5 | C1250-Count2 | MNCE | Micronucleated Cells | 2190 | 17 |
|
| 17 | 17 |
| 2022-05-25 | | 14 | 123 | GT | 6 | C1250-Count3 | MNCE | Micronucleated Cells | 2758 | 13 |
|
| 13 | 13 |
| 2022-05-25 | | 15 | 123 | GT | 7 | C1250-Count4 | MNCE | Micronucleated Cells | 2714 | 21 |
|
| 21 | 21 |
| 2022-05-25 | | 16 | 123 | GT | 8 | C1250 | MNCECE | Micronucleated Cells/Total Cells |
| 0.66 | % |
| 0.66 | 0.66 | % | 2022-05-25 |
|
|