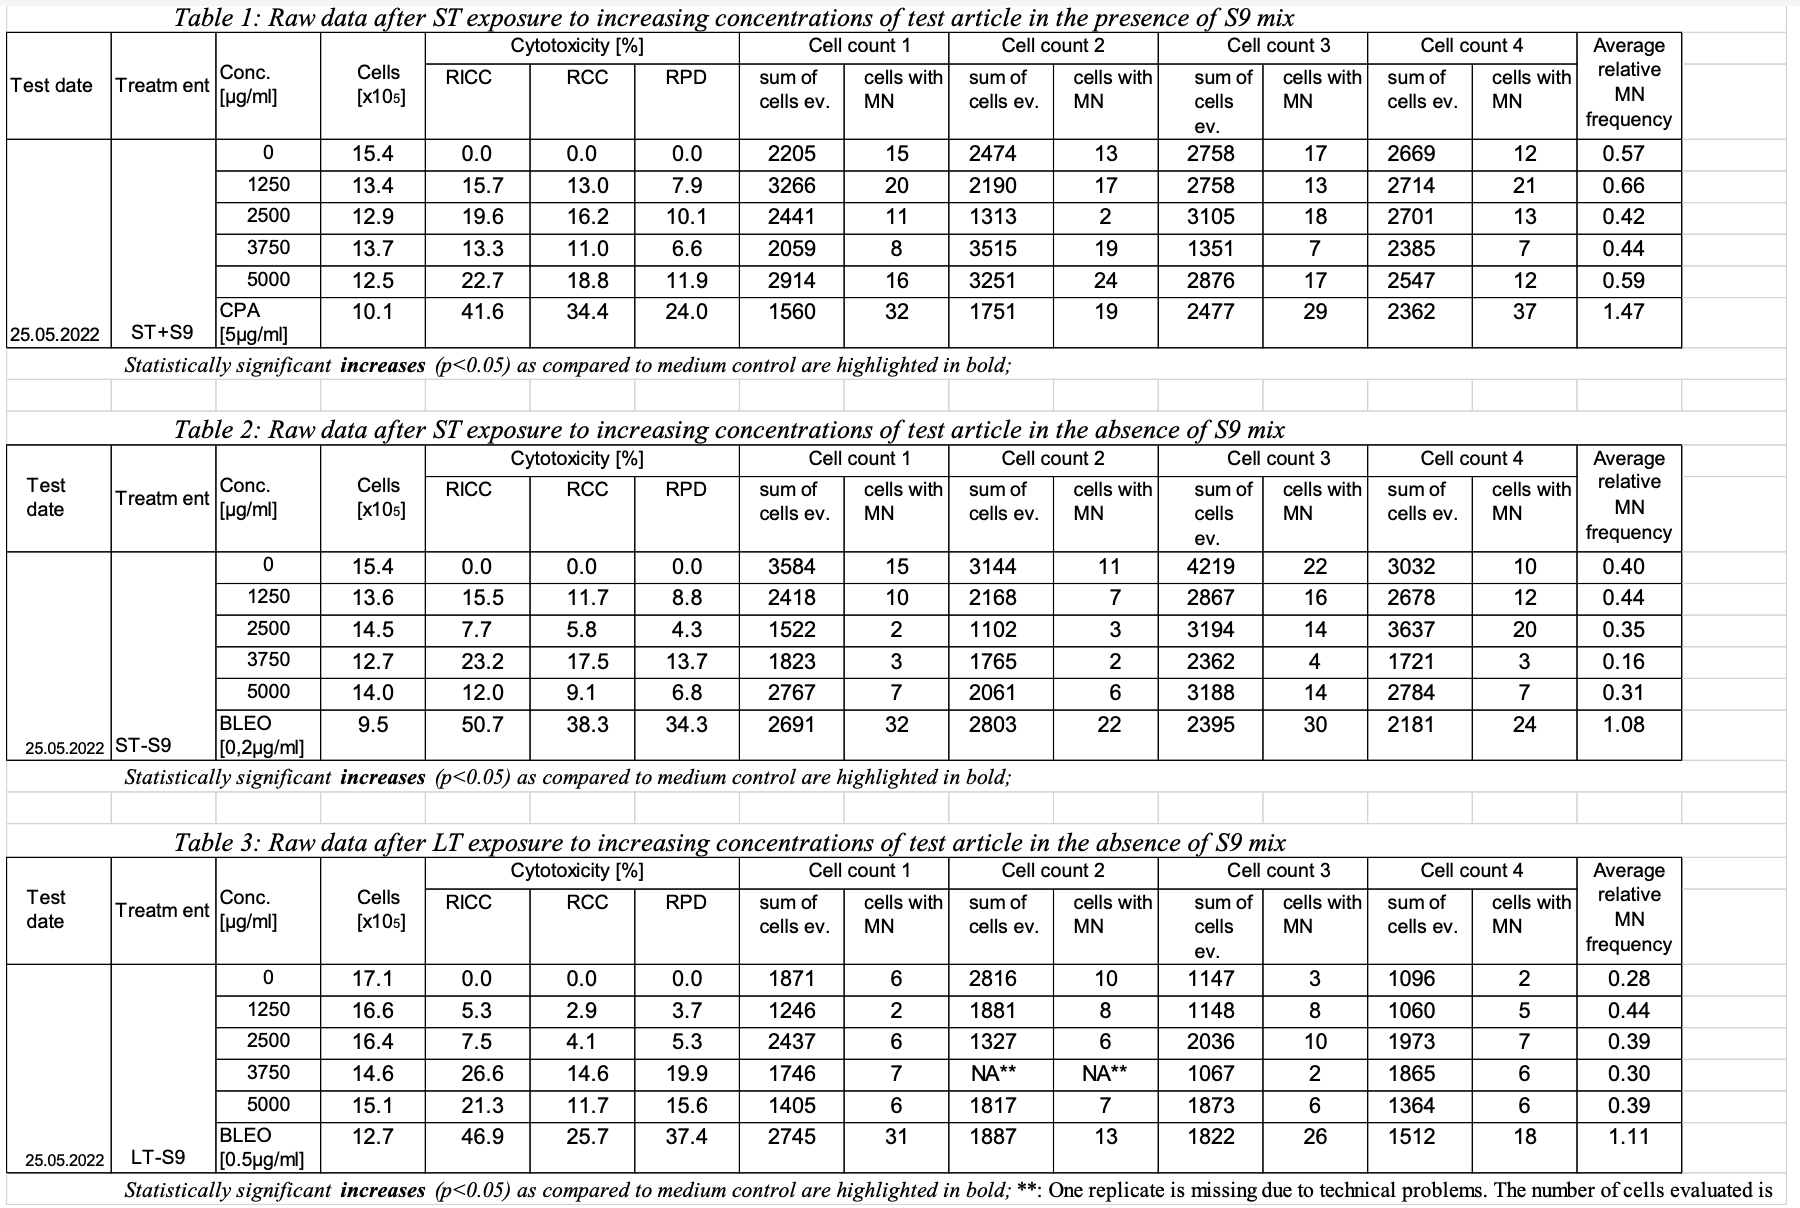
This example shows a sample report table, trial design, and results data dataset for Study #123 study 123 for the determination of the in vitro genotoxicity potential of tobacco products in using the in vitro Micronucleus Assaymicronucleus assay.
| Expand |
|---|
| title | Sample Report Table for Study 123 |
|---|
|
|
| Dataset wrap |
|---|
| Rowcaps |
|---|
| Rows 1-2: | Show two 2 records for TSPARMCD = "GLPTYP", using TSSEQ to indicate multiple records, since both GLP Types types apply for this example study. | | Row | 8| 3: | Shows that | the sponsor's study reference ID is not applicable| this study was conducted as a GLP study. | | Rows 4-5: | Show the study start date and study title. | | Rows | 9| 6-7: | Show the version of SEND Implementation Guide and version of Controlled Terminology used in this study. | | Row 8: | Shows the applicant's organization. | | Row 9: | Shows that the applicant's study reference ID is not applicable. | | Rows 10-13: | Show that TSGRPID has been used to 12:Show that TSGRPID has been used to link records (name, location, country) related to the test facility (TSGRPID = 1). The Study Director study director is associated with the Test Facility.test facility. | | Rows 14-16: | Show that TSGRPID (TSGRPID=2) has been used to link the information on the testing guideline followed on this study (TSTGDNAM, TSTGDORG, TSTGDVER). | | Shows the study type for this study. | | Shows that this study includes a Mammalian Cell Micronucleus Assay. | | Rows 19-20: | Show that the species is human and the cell line is TK6 lymphoblastoid in this study. |
|
| Dataset2 |
|---|
| Dataset2 |
|---|
Row | STUDYID | ASSAYID | DOMAIN | TSSEQ | TSGRPID | TSPARMCD | TSPARM | TSVAL | TSVALNF |
|---|
| 1 | 123 |
NRU | | TS | 1 |
| GLPTYP | Good Laboratory Practice Type | FDA |
| | 2 | 123 |
NRU | TS | 2 |
| GLPTYP | Good Laboratory Practice Type | OECD |
| | 3 | 123 |
NRU | TS | 1 |
| STSTDTC | Study Start Date | 2022-05-25 |
4NRU | TS | 1 |
| STITLE | Study Title | Determination of the in vitro genotoxicity potential using the in vitro Neutral Red Uptake assay |
5NRU | TS | 1 |
| SNDIGVER | SEND Implementation Guide Version | TOBACCO IMPLEMENTATION GUIDE VERSION 1.0 |
6NRU | TS | 1 |
| SNDCTVER | SEND Controlled Terminology Version | SEND Terminology 2021-09-30 |
7NRUSSPONSORSponsor Organization Sponsor 8NRU | SPREFIDSponsor | Study Reference ID |
| NOT APPLICABLE |
9NRU | TS | 1 | 1 | TSTFNAM | Test Facility Name | Example Test Lab Name |
10NRU | | TS | 1 | 1 | TSTFLOC | Test Facility Location | 10 Somewhere Street, Montgomery, AL 10000 |
11NRU | | TS | 1 | 1 | TFCNTRY | Test Facility Country | USA |
12NRU | TS | 1 | 1 | STDIR | Study Director | Dr. R. Smith |
13NRUGLPFLGLP Flag | Y | | TSTGDNAM | Testing Guideline Name | GUIDELINE FOR THE TESTING OF CHEMICALS No. 487 |
| | 15 |
14NRU | ASTD | Assay Standard | NIH Publication No. 07-4519 | | TSTGDORG | Testing Guideline Organization | OECD |
| | 16 | 123 |
15 | 123 | NRUASTDVAssay Standard | Testing Guideline Version |
20061116NRU | TS | 1 |
| SSTYP | Study Type | GENOTOXICITY IN VITRO |
17NRUSSSTYP | Study Sub Type | In Vitro Neutral Red Uptake |
| GNTXAID | Genetic Toxicology Assay Identifier | MNvit |
| | 19 | 123 |
18 | 123 | NRUHamster19NRUTESTSYSTest System | CHO |
|
This example trial set dataset, tx.xpt, Trial Sets dataset shows information about the test conditions for set A1 and A2 in this example study, 123. Set Sets A1 and A2 can be seen in the first and second rows respectively of the sample report Table 1 in the Sample Report table for Study 123 (above). For brevity, the trial sets dataset, tx.xpt, and TX dataset and the findings dataset, gt.xpt (GT) dataset do not show information for any other sets. Fully formed datasets for this example study would include information about the test conditions and findings for all sets.
| Dataset wrap |
|---|
|
| Rowcaps |
|---|
24| 23: | Show trial set parameters and |
trial set values that comprise the test conditions for trial set A1. Set A1 is the data for the negative control (concentration 0) with short-term exposure and metabolic activation S9. The applicant has chosen to given a long name (SET) equal to "ST+S9_C0". Set A1 is associated with the first row in the sample report table for study 123. | | Rows |
2547| 46: | Show trial set parameters and |
trial set values that comprise the test conditions for trial set A2. Set A2 is the data for the short-term exposure with metabolic activation S9 at a concentration of 1250 ug/ml. |
The applicant has chosen to give the set a long name (SET) equal to "ST+S9_C1250". Set A2 is associated with the second row in the sample report table for study 123. |
|
| Dataset2 |
|---|
GNTXAID | DOMAIN | SETCD | SET | TXSEQ | TXPARMCD | TXPARM | TXVAL |
|---|
| 1 | 123 |
MNvit2METACT Activation| Activating Agent Name | +S9 | | 2 | 123 |
MNvit | 3Y/N presence of metabolic activation| Presence of Metabolic Activation Flag | Y | | 3 | 123 |
MNvit4TRTDMINIVTDMIN | In vitro Treatment Duration Minimum | 3 | | 4 | 123 |
MNvit5TRTDTRG| IVTDTRG | In vitro Treatment Duration Target | 3.5 | | 5 | 123 |
MNvit | 6TRTDMAX| IVTDMAX | In vitro Treatment Duration Maximum | 4 | | 6 | 123 |
MNvit7TRTDU| IVTDU | In vitro Treatment Duration Unit | HOURS | | 7 | 123 |
MNvit | 8| 7 | RCVDMIN | Recovery Duration Minimum | 23.5 | | 8 | 123 |
MNvit9| 8 | RCVDTRG | Recovery Duration Target | 24 | | 9 | 123 |
MNvit10| 9 | RCVDMAX | Recovery Duration Maximum | 24.5 | | 10 | 123 |
MNvit11| 10 | RCVDU | Recovery Duration Unit | HOURS | | 11 | 123 |
MNvit12| 11 | INCBTMP | Incubation Temperature | 37 | | 12 | 123 |
MNvit13| 12 | INCBTMPU | Incubation Temperature Unit | C | | 13 | 123 |
MNvit14HUMID| ATMRHP | Atmospheric Relative Humidity Percent | 50 | | 14 | 123 |
MNvit | 15ATMCO2| ATMCO2P | Atmospheric CO2 Percent | 5 | | 15 | 123 |
MNvit16Sponsor Applicant-defined tobacco identifier | CIG01a | | 16 | 123 |
MNvit17MNvit18| 17 | SAMTYP | Sample Type | Total Particulate Matter in DMSO | | 18 | 123 |
MNvitC019INTRVNName of the Intervention Article Name | Tobacco ProdA | | 19 | 123 |
MNvit20type of intervention articleIntervention Article Type | Negative Control | | 20 | 123 |
MNvit | 21| 20 | ITVCONC | Intervention Article Concentration |
of intervention articleMNvit22| 21 | ITVCONCU | Intervention Article Concentration Unit | ug/ml | | 22 | 123 |
MNvit | 23Sponsor | Applicant-defined device identifier | PUFFMASTER3K | | 23 | 123 |
MNvit24DUREFIDSmoke Medium Intensity Regimen| MEDIUM INTENSITY REGIMEN | | 24 | 123 |
MNvit2METACT Activation| Activating Agent Name | +S9 | | 25 | 123 |
MNvit | 3Y/N presence of metabolic activation| Presence of Metabolic Activation Flag | Y | | 26 | 123 |
MNvit | 4TRTDMINIVTDMIN | In vitro Treatment Duration Minimum | 3 | | 27 | 123 |
MNvit5TRTDTRG| IVTDTRG | In vitro Treatment Duration Target | 3.5 | | 28 | 123 |
MNvit | 6TRTDMAX| IVTDMAX | In vitro Treatment Duration Maximum | 4 | | 29 | 123 |
MNvit7TRTDU| IVTDU | In vitro Treatment Duration Unit | HOURS | | 30 | 123 |
MNvit8| 30 | RCVDMIN | Recovery Duration Minimum | 23.5 | | 31 | 123 |
MNvit9| 31 | RCVDTRG | Recovery Duration Target | 24 | | 32 | 123 |
MNvit10| 32 | RCVDMAX | Recovery Duration Maximum | 24.5 | | 33 | 123 |
MNvit11| 33 | RCVDU | Recovery Duration Unit | HOURS | | 34 | 123 |
MNvit12| 34 | INCBTMP | Incubation Temperature | 37 | | 35 | 123 |
MNvit13| 35 | INCBTMPU | Incubation Temperature Unit | C | | 36 | 123 |
MNvit | 14HUMID| ATMRHP | Atmospheric Relative |
Humidity MNvit15ATMCO2| ATMCO2P | Atmospheric CO2 Percent | 5 | | 38 | 123 |
MNvit16Sponsor Applicant-defined tobacco identifier | CIG01a | | 39 | 123 |
MNvit | 17MNvit18| 40 | SAMTYP | Sample Type | Total Particulate Matter in DMSO | | 41 | 123 |
MNvit19INTRVNName of the Intervention Article Name | Tobacco ProdA | | 42 | 123 |
MNvit20type of intervention articleIntervention Article Type | Product | | 43 | 123 |
MNvit | 21| 43 | ITVCONC | Intervention Article Concentration |
of intervention articleMNvit22| 44 | ITVCONCU | Intervention Article Concentration Unit | ug/ml | | 45 | 123 |
MNvit | 23Sponsor defined device identifier| Applicant-defined Device Identifier | PUFFMASTER2023 | | 46 | 123 |
MNvit | 24DUREFIDSmoke High Intensity Regimen | |
|
| Dataset2 |
|---|
|
Row | STUDYID | GNTXAID | SETCD | REFID | PARENT | LEVEL | LVLDESC |
|---|
1 | 8325064 | Ames | SetA | A | 1 | TRIAL SET | 2 | 8325064 | Ames | SetA | 0_1 | A | 2 | OBSERVATIONAL UNIT |
|---|
3 | 8325064 | Ames | SetA | 0_2 | A | 2 | OBSERVATIONAL UNIT |
|---|
4 | 18 | | Expand |
|---|
|
| Row | STUDYID | ASSAYID | DOMAIN | SETCD | EUID | OBUID |
|---|
1 | 123 | MNvit | EI | A1 | C0 | 2 | 123 | MNvit | EI | A2 | C1250 | | Dataset wrap |
|---|
|
|
| Dataset wrap |
|---|
|
| Rowcaps |
|---|
| Row 1: | Shows the value of REFID=C0. This REFID refers to the trial set with a SETCD of "A1", as defined in the TX dataset. LEVEL=1 and LVLDESC="EXPERIMENTAL UNIT/TRIAL SET" indicates this identifier is referring to both the experimental unit and the unit to which the treatment is applied, and to the entire trial set. | | Rows 2-5: | Show the values of 4 observational units (C0_Count1 through C0_Count4) that are within the parent experimental unit, REFID=C0. In this example assay, these observational units are also all within the same trial set, as defined in the TX dataset. | | Row 6: | Shows the value of REFID=C1250. This REFID refers to the trial set with a SETCD of "A2", as defined in the TX dataset. LEVEL=1 and LVLDESC="EXPERIMENTAL UNIT/TRIAL SET" indicates this identifier is referring to both the experimental unit and the unit to which the treatment is applied, and to the entire trial set. | | Rows 7-10: | Show the values of 4 observational units (C1250_Count1 through C1250_Count4) that are within the parent experimental unit, REFID=C1250. In this example assay, these observational units are also all within the same trial set, as defined in the TX dataset. |
|
| Dataset2 |
|---|
| Row | STUDYID | SETCD | REFID | PARENT | LEVEL | LVLDESC |
|---|
1 | 123 | | C0 |
| 1 | EXPERIMENTAL UNIT/TRIAL SET | 2 | 123 | A1 | C0-Count1 | C0 | 2 | OBSERVATIONAL UNIT | 3 | 123 | A1 | C0-Count2 | C0 | 2 | OBSERVATIONAL UNIT | 4 | 123 | A1 | C0-Count3 | C0 | 2 | OBSERVATIONAL UNIT | 5 | 123 | A1 | C0-Count4 | C0 | 2 | OBSERVATIONAL UNIT | 6 | 123 | A2 | C1250 |
| 1 | EXPERIMENTAL UNIT/TRIAL SET | | 7 | 123 | A2 | C1250-Count1 | C1250 | 2 | OBSERVATIONAL UNIT | | 8 | 123 | A2 | C1250-Count2 | C1250 | 2 | OBSERVATIONAL UNIT | | 9 | 123 | A2 | C1250-Count3 | C1250 | 2 | OBSERVATIONAL UNIT | | 10 | 123 | A2 | C1250-Count4 | C1250 | 2 | OBSERVATIONAL UNIT |
|
|
| Dataset wrap |
|---|
|
| Rowcaps |
|---|
Rows 1-3, 8: | Show percentage result values that apply to GTREFID=C0. REFID=C0, as shown in the RELREF dataset, relates this data to the trial set in the first row of table 1 in the sample report table for study 123. | | Rows 4-7: | Show the 4 micronucleated cell counts for the observational units with GTREFID from C0-Count1 through C0-Count4, for which their relationship to test conditions (in tx.xpt) and experimental units (in relref.xpt) are shown in the RELREF dataset. | Rows 9-11, 16: | Show percentage result values that apply to GTREFID=C1250. REFID=C1250, as shown in the RELREF dataset, relates this data to the trial set in the second row of table 1 in the sample report table for study 123. | | Rows 12-15: | Show the 4 micronucleated cell counts for the observational units with GTREFID from C1250-Count1 through C1250-Count4, for which their relationship to test conditions (in tx.xpt) and experimental units (in relref.xpt) are shown in the RELREF dataset. |
|
|
| Rowcaps |
|---|
| Rows 1-5: | Show the number of revertant colonies per plate collected for each of five observational units ( REFID=0_1 through 0_5 as described in the relref dataset). |
| Rows 6, 7: | Show summary values collected (MEAN, STANDARD DEVIATION) for REFID=A that apply to the entire trial set, SetA, as indicated by LEVEL=1 and LVLDESC=TRIAL SET for this REFID in the relref dataset. |
| Rows 8-13: | Revertent colonies were counted for each of three plates/observational units (REFID=6_1 through 6_3) and each value is associated with a record to show a postfix code of "V" = "Very thin background bacterial lawn" |
| Rows 14-16: | Show summary values collected (MEAN, STANDARD DEVIATION, and FOLD INCREASE) for REFID=F that apply to the entire trial set, SetF, as indicated by LEVEL=1 and LVLDESC=TRIAL SET for this REFID in the relref dataset. |
| Rows 17-19: | Show three plates/observational units (REFID=5_1 through 5_3) where no revertant colonies were counted due to too much cytotoxicity and a postfix code of "T". |
| Rows 20-22: | Show the number of revertant colonies per plate collected for each of three observational units (REFID=18_1 through 18_3 as described in the relref dataset). |
| Rows 23-25: | Show summary values collected (MEAN, STANDARD DEVIATION, and FOLD INCREASE) for REFID=R that apply to the entire trial set, SetR, as indicated by LEVEL=1 and LVLDESC=TRIAL SET for this REFID in the relref dataset. |
| Dataset2 |
|---|
Row | STUDYID | GNTXAID | DOMAIN | EUID | OBUID
REFID | GTSEQ | GTTESTCD | GTTEST | GTCELLEV
(cells evaluated) | GTORRES | GTORRESU | GTCOLSRT ??? | GTSTRESC | GTSTRESN | GTSTRESU | GTDTC | 1 | 123 | MNvit | GT | C0 | 1 | RICC | Relative Increase in Cell Count | 154 | 0 | % | 0 | 0 | % | 2022-05-25 | 2 | 123 | MNvit | GT | C0 | 2 | RCC | Relative Cell Count | 154 | 0 | % | 0 | 0 | % | 2022-05-25 | 3 | 123 | MNvit | GT | C0 | 3 | RPD | Relative Population Doubling | 154 | 0 | % | 0 | 0 | % | 2022-05-25 | 4 | 123 | MNvit | GT | C0 | 4 | MNCELLS | Micronucleated Cells | 2205 | 15 | Cells | 15 | 15 | Cells | 2022-05-25 | 5 | 123 | MNvit | GT | C0 | 5 | MNCELLS | Micronucleated Cells | 2474 | 13 | Cells | 13 | 13 | Cells | 2022-05-25 | 6 | 123 | MNvit | GT | C0 | 6 | MNCELLS | Micronucleated Cells | 2758 | 17 | Cells | 17 | 17 | Cells | 2022-05-25 | 7 | 123 | MNvit | GT | C0 | 7 | MNCELLS | Micronucleated Cells | 2669 | 12 | Cells | 12 | 12 | Cells | 2022-05-25 | 8 | 123 | MNvit | GT | C0 | 8 | AVGREL | Average Relative MN Frequency | 0.57 | % | 0.57 | 0.57 | % | 2022-05-25 | 9 | 123 | MNvit | GT | C1250 | 1 | RICC | Relative Increase in Cell Count | 134 | 15.7 | % | 15.7 | 15.7 | % | 2022-05-25 | 10 | 123 | MNvit | GT | C1250 | 2 | RCC | Relative Cell Count | 134 | 13.0 | % | 13.0 | 13.0 | % | 2022-05-25 | 11 | 123 | MNvit | GT | C1250 | 3 | RPD | Relative Population Doubling | 134 | 7.9 | % | 7.9 | 7.9 | % | 2022-05-25 | 12 | 123 | MNvit | GT | C1250 | 4 | MNCELLS | Micronucleated Cells | 3266 | 20 | Cells | 20 | 20 | Cells | 2022-05-25 | 13 | 123 | MNvit | GT | C1250 | 5 | MNCELLS | Micronucleated Cells | 2190 | 17 | Cells | 17 | 17 | Cells | 2022-05-25 | 14 | 123 | MNvit | GT | C1250 | 6 | MNCELLS | Micronucleated Cells | 2758 | 13 | Cells | 13 | 13 | Cells | 2022-05-25 | 15 | 123 | MNvit | GT | C1250 | 7 | MNCELLS | Micronucleated Cells | 2714 | 21 | Cells | 21 | 21 | Cells | 2022-05-25 | 16 | 123 | MNvit | GT | C1250 | 8 | AVGREL | Average Relative MN Frequency | 0.66 | % | 0.66 | 0.66 | % | 2022-05-25 | | Expand |
|---|
| title | gt.xpt (similar to LB) |
|---|
|
A1:  Image Removed Image Removed A2:  Image Removed Image Removed | Row | STUDYID | GNTXAID | DOMAIN | EUID | OBUID
REFID | GTSEQ | GTTESTCD | GTTEST | GTCELLEV
(cells evaluated) | GTORRES | GTORRESU | GTCOLSRT ??? | | Dataset2 |
|---|
| Row | STUDYID | DOMAIN | GTSEQ | GTREFID | GTTESTCD | GTTEST | GTCELLEV | GTORRES | GTORRESU | GTCOLSRT |
|---|
|
| GTSTRESC | GTSTRESN | GTSTRESU | GTDTC |
|---|
| 1 | 123 |
|
MNvit1 | | Relative Increase in Cell Count | 154 | 0 | % |
| 0 | 0 | % | 2022-05-25 | | 2 | 123 |
|
MNvitGT2 | | RCC | Relative Cell Count | 154 | 0 | % |
| 0 | 0 | % | 2022-05-25 | | 3 | 123 |
|
MNvitGT3 | RPD | Relative Population Doubling | 154 | 0 | % |
| 0 | 0 | % | 2022-05-25 | | 4 | 123 |
|
MNvitGT4 | MNCELLS| MNCE | Micronucleated Cells | 2205 | 15 |
|
Cells | CellsMNvitGT5MNCELLS | | Micronucleated Cells | 2474 | 13 |
|
CellsCells | MNvitGT6MNCELLS | | Micronucleated Cells | 2758 | 17 |
|
CellsCells | MNvitMNCELLS7 | | MNCE | Micronucleated Cells | 2669 | 12 |
|
Cells | CellsMNvitGT8 | AVGREL | Average Relative MN Frequency | | MNCECE | Micronucleated Cells/Total Cells |
| 0.57 | % |
| 0.57 | 0.57 | % | 2022-05-25 | | 9 | 123 |
|
MNvitGT1 | RICC | Relative Increase in Cell Count | 134 | 15.7 | % |
| 15.7 | 15.7 | % | 2022-05-25 | | 10 | 123 |
|
MNvitGT2 | RCC | Relative Cell Count | 134 | 13.0 | % |
| 13.0 | 13.0 | % | 2022-05-25 | | 11 | 123 |
|
MNvitGT3 | RPD | Relative Population Doubling | 134 | 7.9 | % |
| 7.9 | 7.9 | % | 2022-05-25 | | 12 | 123 |
|
MNvitGTMNCELLS4 | | MNCE | Micronucleated Cells | 3266 | 20 |
|
Cells | CellsMNvitGTMNCELLS5 | | MNCE | Micronucleated Cells | 2190 | 17 |
|
Cells | CellsMNvitGT6MNCELLS | | Micronucleated Cells | 2758 | 13 |
|
CellsCells | MNvitGT7MNCELLS | | Micronucleated Cells | 2714 | 21 |
|
CellsCells | MNvitGT8 | AVGREL | | MNCECE | Micronucleated Cells/Total Cells |
|
Average Relative MN Frequency
|---|