For the purposes of team review of the example data, the report is included in this section: Sample data #1: Determination of the in vitro genotoxicity potential of 10 tobacco products in the in vitro Micronucleus Assay Study info: This study was performed to assess the in vitro genotoxicity of 10 different tobacco products containing 1% to 2% nicotine. The genotoxic potential was determined using the in vitro micronucleus test with TK6 lymphoblastoid suspension cells. The study was conducted in compliance with the following documents: - OECD TG 487 (2010): Guideline for the testing of chemicals: In vitro mammalian cell micronucleus test.
- BL SOP 132: Determination of the in vitro genotoxicity of condensates from tobacco products and ingredients for tobacco products / electronic vapour products – in vitro micronucleus test (IVM) with TK6 cells.
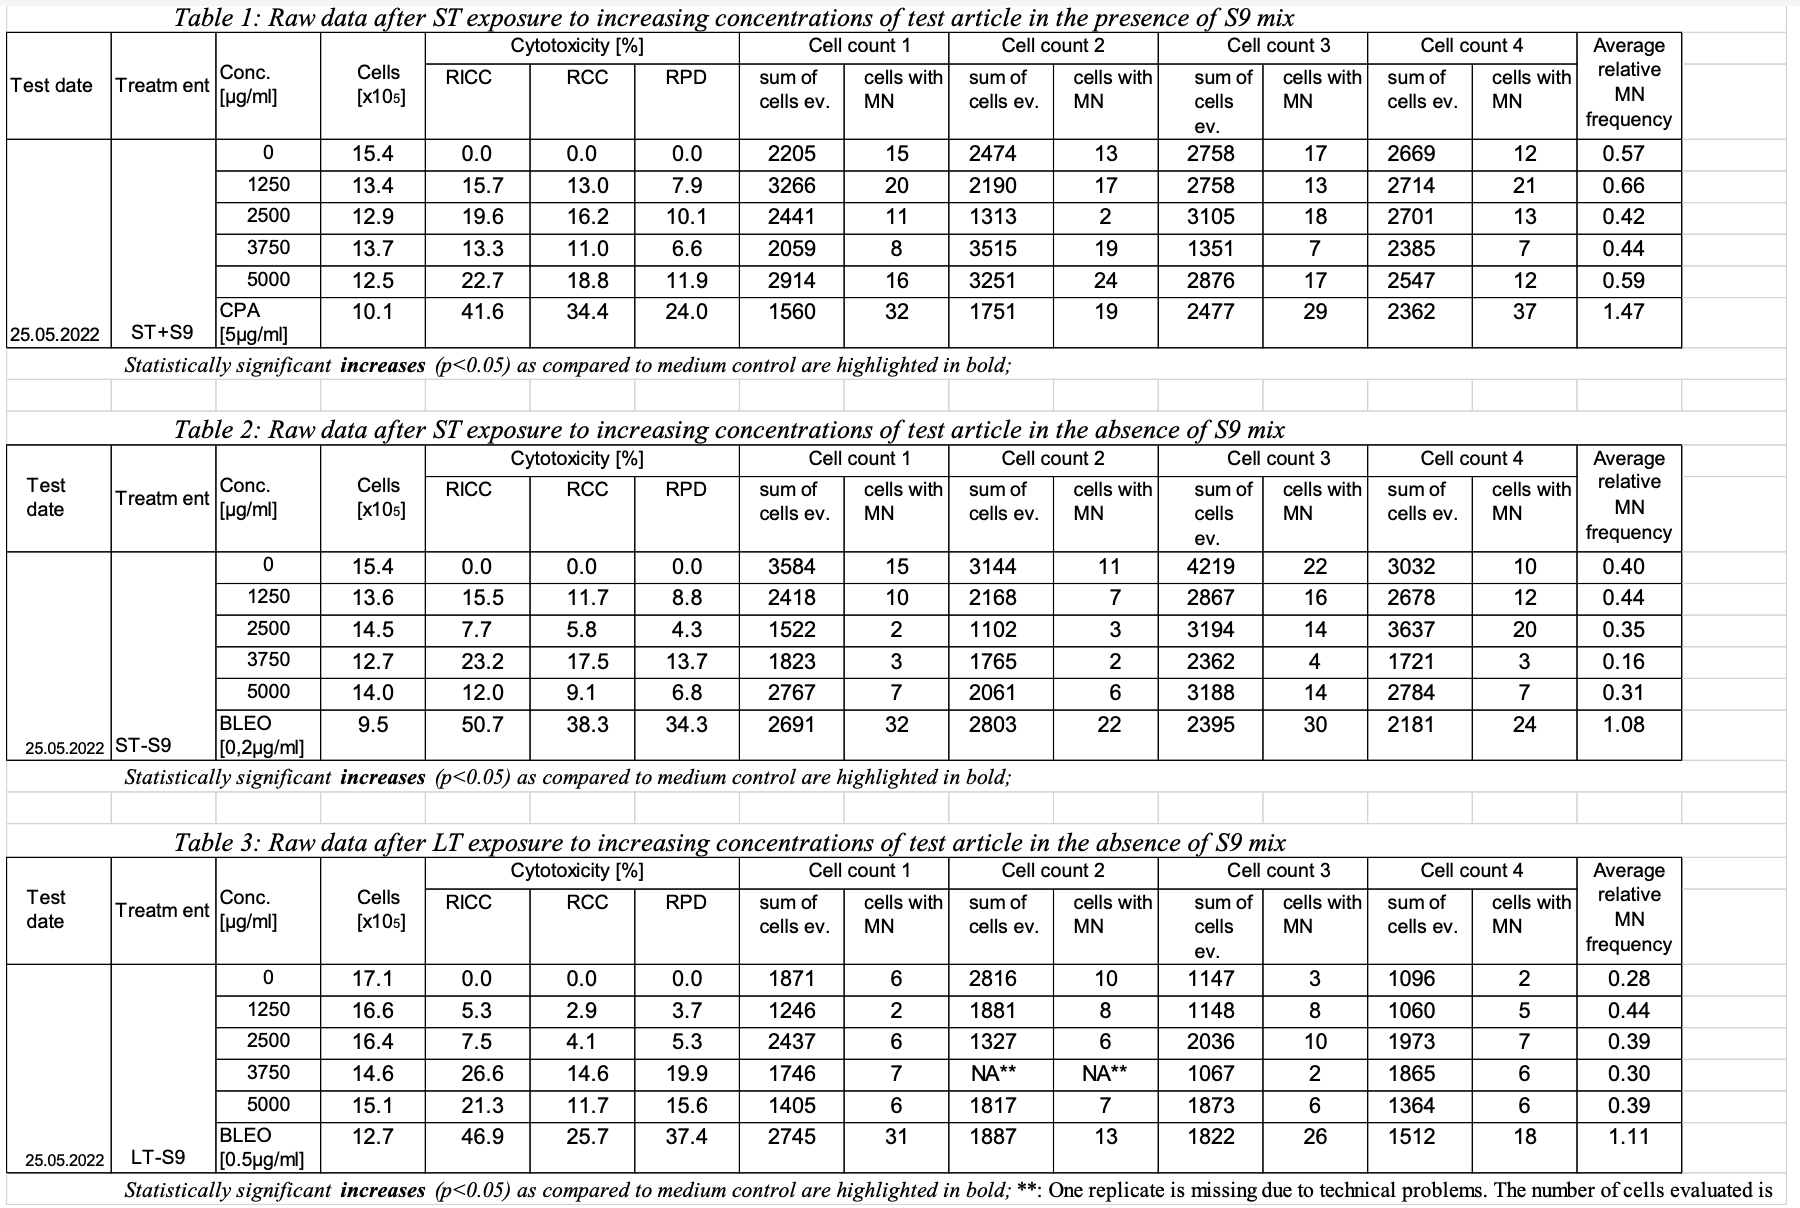
The cells were exposed to increasing dose levels of tobacco product using short term treatment in the presence and absence of an external metabolic activation system (ST+/-S9 mix) as well as a long term treatment in the absence of an external metabolic activation system (LT-S9 mix). Toxicity was calculated as relative increase in cell count (RICC), relative cell count (RCC) and relative population doubling (RPD). RPD is the cytotoxicity measure used for the assessment. RICC and RCC are also reported but not considered for the assessment. Note: OECD GUIDELINE FOR THE TESTING OF CHEMICALS Population Doubling = [log (Post-treatment cell number ÷ Initial cell number)] ÷ log 2
Conclusion: All tobacco product evaluated did not induce any signs of severe toxicity or genotoxicity in any of the treatments and do not fulfil the criteria to be classified as genotoxic. Reported results: (only listed the result of one tobacco product as an example) - Statistical analysis
Adjusted p-values calculated for the micronucleus frequencies for every dose level as compared to the corresponding solvent control after ST in the presence and absence of S9 mix as well as LT in the absence of S9 mix. One way ANOVA with posthoc Dunnett’s test for multiple comparisons for the dose response and a two tailed unpaired student’s t-test for the comparison of positive and negative control were used. The difference between the samples is considered statistically significant at p≤0.05.
Treatment |
Test date |
Concentration [µg/ml] | Fold increase of MN over background |
Adjusted p- value | Significant increase Y/N |
ST+ S9 |
25.05.2022 | 1250 | 0.9 | 0.9973 | N | 2500 | 0.9 | 0.9517 | N | 3750 | 0.6 | 0.2654 | N | 5000 | 0.9 | 0.9895 | N | CPA [5µg/ml] | 3.1 | 0.0003 | Y |
ST-S9 |
25.05.2022 | 1250 | 1.6 | 0.6408 | N | 2500 | 1.3 | 0.8995 | N | 3750 | 2.9 | 0.0106 | N | 5000 | 1.0 | > 0.9999 | N | Bleo [0.2µg/ml] | 3.8 | 0.0002 | Y |
LT-S9 |
25.05.2022 | 1250 | 0.7 | 0.5958 | N | 2500 | 1.3 | 0.6378 | N | 3750 | 0.5 | 0.1146 | N | 5000 | 1.1 | 0.9929 | N | Bleo [0.5µg/ml] | 2.9 | 0.0047 | Y |
Bleo: Bleomycin; CPA: Cyclophosphamid A; statistically significant increases are highlighted in bold.
|